Summer Template for Male and Female Analysis – Customer Insights
RJ0600109_21
- Last Update 07/20/2025
- File Size 0.4MB
- # of Slides 2
- File Format PPTX
- Slide Ratio 16:9
- Color
Keywords
About the Product
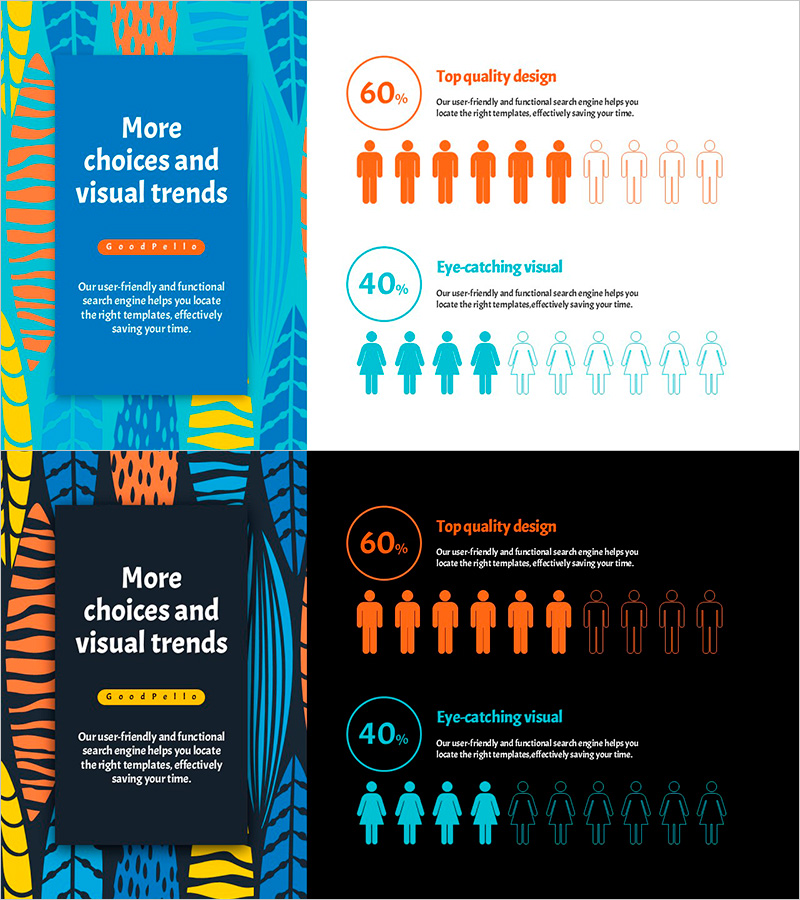
A 2-slide PowerPoint presentation designed to visualize customer analysis and market insights through gender-based segmentation. The slides feature contrasting orange and blue backgrounds with a ratio comparison layout combining circular percentage indicators and human icons. The left section contains key messaging space, while the right side displays 60% versus 40% proportions in an intuitive infographic format. Ideal for marketing presentations, market analysis reports, and customer profiling in business proposals. Fully editable PPTX format ready for immediate customization.
Usage Points
-
Main Usage
Visualize customer demographic data by gender ratio to support marketing strategy development and target audience segmentation. The combination of circular charts and human icons transforms complex statistical information into an immediately understandable visual format for decision-making.
-
How to Use
Deploy in marketing strategy presentations, market analysis reports, investor pitch decks, and executive briefings to explain customer composition and demographic distribution. Simply update the text area on the left with your key message and modify the percentage data on the right to reflect actual figures for immediate use.
-
Recommended For
Marketing managers, business planning teams, market research analysts, and sales directors presenting customer segmentation strategies. Particularly valuable for gender-based targeting discussions, customer profile analysis, and market share comparisons in formal presentations.
-
Slide Structure
Two-slide deck with Slide 1 featuring an orange background, left text area, and right-side 60% infographic display, and Slide 2 with black background in identical layout. Each slide contains one title area, one description text block, one circular percentage indicator, and ten human icons for demographic representation and comparison analysis.
Related Products
-

Gender Comparative Analysis Detailed Graph – Market and Customer Insights
#Market and Competitor Analysis #Graph #Other
-

Infographic Slide for User Gender Analysis
#Market and Competitor Analysis #Graph #Other
-

Children Detail Analysis Chart – Customer Insights and Success Stories
#Market and Competitor Analysis #Customer Success Stories #Graph
-

Customer Analysis and Market Share Graph – Harmony of Blue and Red
#Market and Competitor Analysis #Graph #Other
