Flower Bloom Chart – Market Status and Competitive Advantage
RJ0600108_13
- Last Update 07/20/2025
- File Size 1.5MB
- # of Slides 2
- File Format PPTX
- Slide Ratio 16:9
- Color
Keywords
About the Product
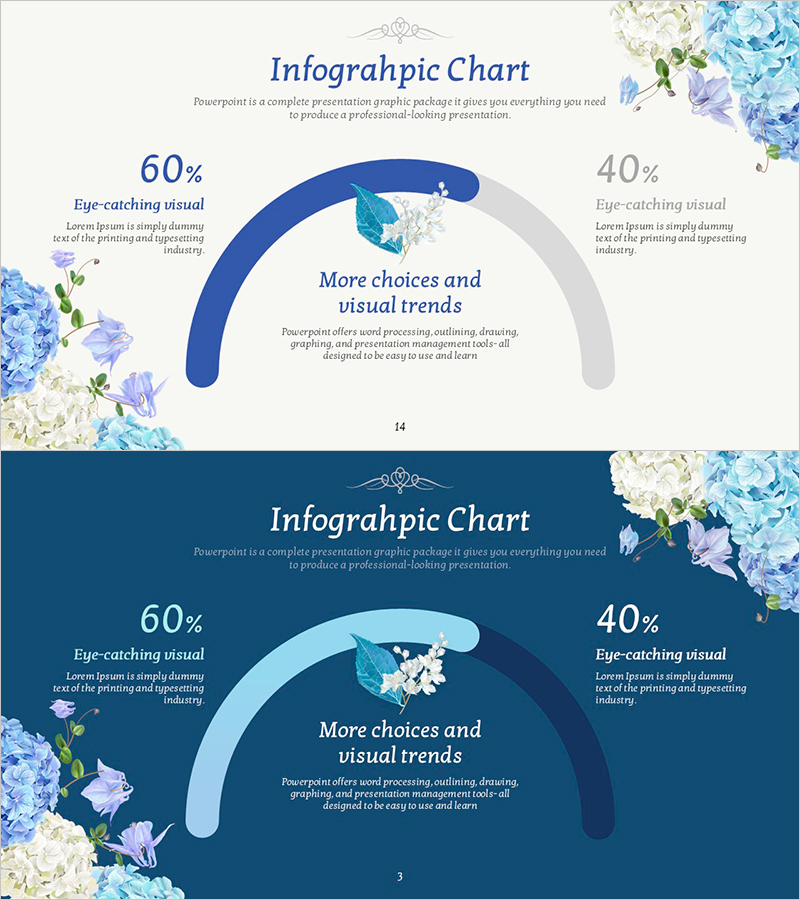
A professional infographic chart PowerPoint slide for comparing market status and competitive advantage at a glance. Features a light beige background with dark blue and light blue curved chart elements that intuitively display 60% vs 40% ratio comparisons, complemented by a symmetrical layout with blue flower illustrations for visual balance. The 2-slide set provides both light and dark background tone options to match your presentation style. With 4 text input areas (left percentage, right percentage, center title, description), you can immediately apply it to competitive analysis, market share, customer satisfaction metrics, and other comparative data visualization needs.
Usage Points
-
Main Usage
Optimized for visualizing comparative data between two items such as competitive analysis, market share, and customer satisfaction metrics. The curved chart structure emphasizes comparison data, while the center title area focuses audience attention on your key message.
-
How to Use
Enter comparative percentages in the left and right input areas, add the comparison category name (e.g., market share, customer satisfaction) in the center title field, and briefly describe data sources or analysis findings in the description text area. Choose between light or dark background tone to match your document style.
-
Recommended For
Ideal for business plans, investment pitch decks, marketing strategy presentations, and market analysis reports where competitive advantage needs emphasis. Particularly effective for executive, investor, and partner presentations to clearly communicate your company's market position.
-
Slide Structure
2-slide set (1 light tone, 1 dark tone) with 4 text input areas: left percentage, right percentage, center title, and description. The curved chart elements are fixed; simply edit the numbers and text for immediate use.
Related Products
-

Donut Charts by Technology – Market Status and Competitive Advantage
#Market and Competitor Analysis #Graph #Market Status
-

Blue Line Wide Template Vertical Bar Chart – Market Status Analysis
#Market and Competitor Analysis #Graph #Market Status
-

The Importance of Modern People's Health Care – Insights from Market Analysis
#Market and Competitor Analysis #Graph #Other
-

Company Two-Way Horizontal Bar Graph – Competitive Advantage Analysis
#Market and Competitor Analysis #Graph #Market Status
