Telescope Astrophotographic Infographic – Visualizing Business Development Strategy
RJ0600107_16
- Last Update 07/19/2025
- File Size 2.9MB
- # of Slides 2
- File Format PPTX
- Slide Ratio 16:9
- Color
Keywords
- #Content-Based Slides
- #Design-Based Slides
- #Business Strategy
- #Operational Plan
- #Diagram
- #Business Processes
- #Cluster
- #Chain Diagram
- #Project Progress
- #16:9
- #circular diagram PowerPoint slide
- #4-stage process flow template
- #business progress visualization
- #infographic diagram PPT
- #step-by-step flowchart slide
About the Product
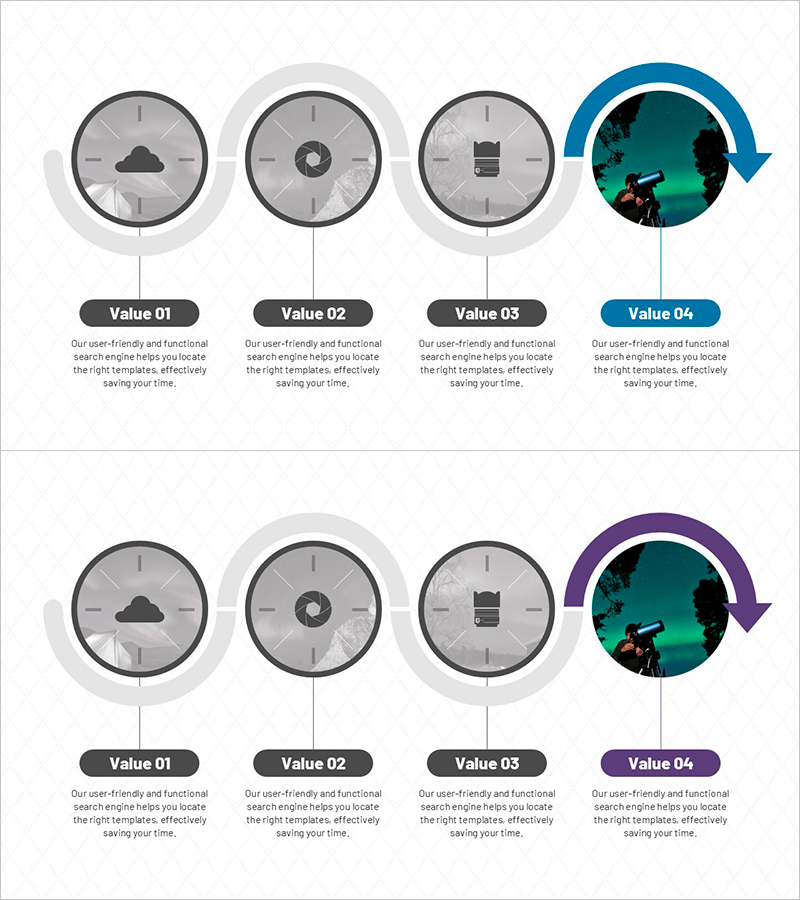
A PowerPoint slide that visualizes business development stages through a 4-node circular diagram structure. This infographic-style slide uses telescope, clock, storage, and astrophotography imagery to convey each phase of progress intuitively. Blue and purple arrows emphasize the circular flow, with detailed description areas positioned below each node for clear process communication. This PPT template is ready to use for business strategy presentations, workflow documentation, and phase-by-phase progress reports.
Usage Points
-
Main Usage
Expresses business development stages through a circular diagram structure to communicate process flow intuitively. Four nodes each contain images and text highlighting stage characteristics, while arrows create a continuous cycle visualizing iterative improvement and repetitive processes.
-
How to Use
Use in business plans, strategy reports, and project status presentations to explain phase-by-phase progress. Customize node images and text to match your business stages and apply across various presentation contexts including meetings, reports, and investor pitches.
-
Recommended For
Recommended for business managers, project managers, strategy planning teams, and executives presenting phase-by-phase progress. Particularly effective for presentations involving cyclical improvement structures, iterative processes, and continuous monitoring requirements.
-
Slide Structure
Two-slide layout featuring a blue-arrow circular structure (4 nodes) on the first slide and a purple-arrow circular structure (4 nodes) on the second. Each node contains a circular image area, label, and description text box below, optimized for 16:9 widescreen format.
Related Products
-

Traffic Accident Connection Diagram - Effective Business Process Development
#Business Strategy #Operational Plan #Diagram
-

Express Your Business Push Strategy with Green-Blue Connected Diagram
#Business Strategy #Operational Plan #Diagram
-

Progress Process Diagram for Business Strategy
#Business Strategy #Operational Plan #Diagram
-

Investment Process Diagram – Visualization of Business Strategy
#Business Strategy #Operational Plan #Diagram
