Express Your Business Push Strategy with Green-Blue Connected Diagram
RJ0600037_25
- Last Update 06/30/2025
- File Size 0.7MB
- # of Slides 2
- File Format PPTX
- Slide Ratio 16:9
- Color
Keywords
- #Content-Based Slides
- #Design-Based Slides
- #Business Strategy
- #Operational Plan
- #Diagram
- #Business Processes
- #Cluster
- #Chain Diagram
- #Project Progress
- #16:9
- #connected diagram PowerPoint
- #business process flow slide
- #4-step workflow template
- #process diagram PPT
- #business strategy presentation slide
About the Product
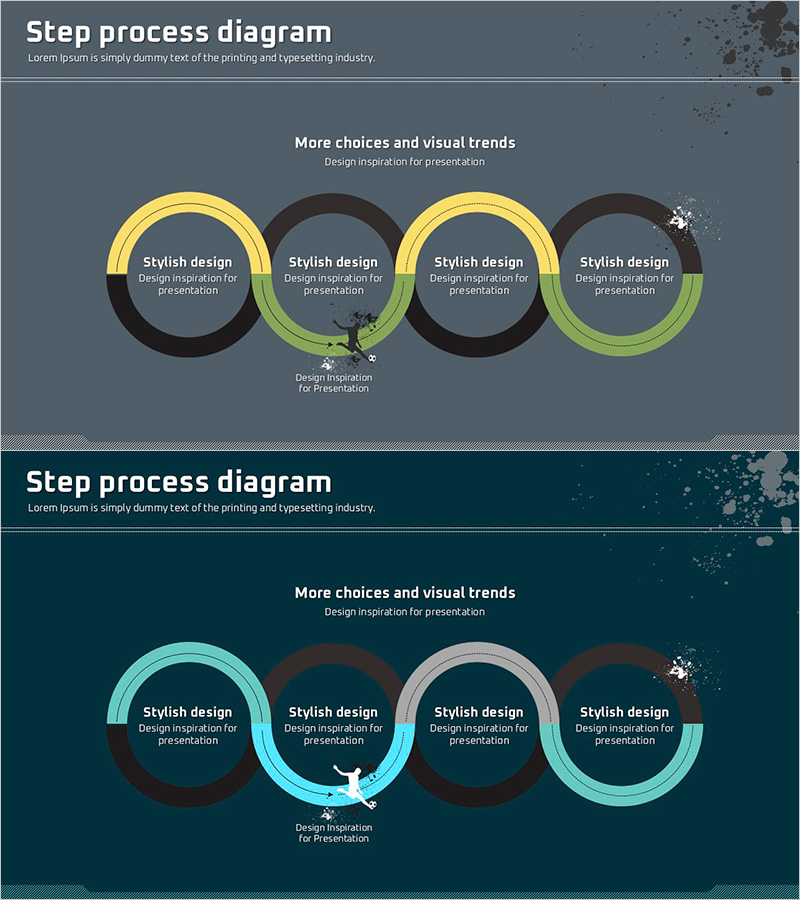
A 4-step connected diagram PowerPoint slide that visualizes business strategy progression and workflow processes. Circular nodes in green and blue tones are linked by arrows to clearly represent sequential advancement. Each node accommodates title and descriptive text, while the dark background creates strong visual contrast with bright accent colors. Comprising 2 slides in 16:9 widescreen PPTX format, this template is ready for immediate editing. Perfect for presenting business milestones, project phases, organizational improvements, and strategic initiatives in professional presentations.
Usage Points
-
Main Usage
Clearly communicate business strategy progression, project phases, and workflow processes divided into 4 sequential steps. Input stage objectives and execution details into each node to systematically explain organizational direction and strategic advancement to your audience.
-
How to Use
Enter stage names (Step 1–4) in the title area of each circular node, and describe the objectives and key activities for that stage in the text section below. The connecting arrows represent relationships between stages, allowing flexible use for sequential progression or cyclical processes.
-
Recommended For
Business planners, project managers, executives preparing reports, organizational improvement specialists, and marketing strategists presenting business milestones. Ideal for investment pitch decks, business plans, management reports, and strategic initiative presentations.
-
Slide Structure
2 slides featuring 4 circular nodes connected by directional arrows. The first slide uses green-yellow tones while the second employs cyan-green variations, providing design flexibility. Each node is independently editable, and the dark background emphasizes the bright accent colors for maximum visual impact.
Related Products
-

Progress Process Diagram for Business Strategy
#Business Strategy #Operational Plan #Diagram
-

Transport Icons and Flowcharts – Business Strategy
#Business Strategy #Operational Plan #Diagram
-

Colored Pencil Flow Diagram – Business Strategy and Operations Planning
#Business Strategy #Operational Plan #Diagram
-

Investment Process Diagram – Visualization of Business Strategy
#Business Strategy #Operational Plan #Diagram
