Investment Process Diagram – Visualization of Business Strategy
RJ0900030_16
- Last Update 08/25/2025
- File Size 0.7MB
- # of Slides 2
- File Format PPTX
- Slide Ratio 16:9
- Color
Keywords
- #Content-Based Slides
- #Design-Based Slides
- #Business Strategy
- #Operational Plan
- #Diagram
- #Business Processes
- #Flow
- #Cluster
- #Linear Flow
- #Chain Diagram
- #Project Progress
- #16:9
- #investment process diagram
- #business strategy PowerPoint
- #4-stage flowchart
- #process diagram slide template
- #business progression visualization
- #investment decision diagram PowerPoint
About the Product
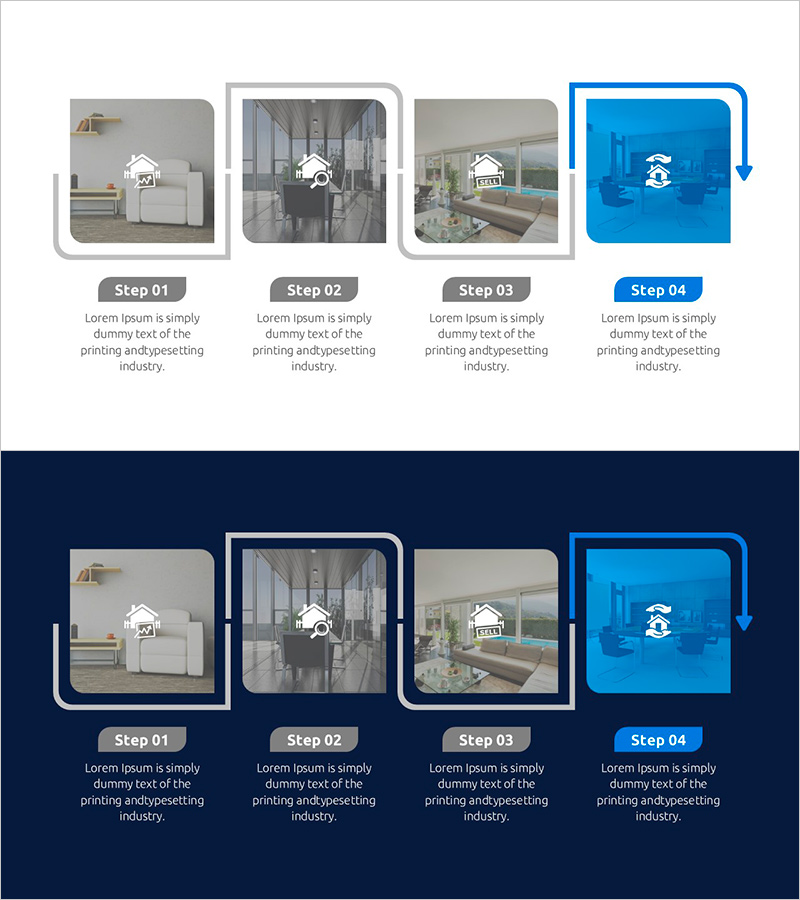
A professional PowerPoint slide featuring a 4-stage investment process diagram that visualizes business strategy and project progression. The design uses a light gray background with blue accent arrows to clearly indicate the flow direction between stages, complemented by stage-specific icons and text input areas for detailed information. This process diagram effectively communicates sequential workflows such as investment review, decision-making, execution, and monitoring. Ideal for executive presentations, business plans, investor pitch decks, and strategic planning sessions.
Usage Points
-
Main Usage
Communicate a 4-stage investment and business progression workflow sequentially, from review through monitoring. Each stage includes dedicated icons and text areas where you can input specific activities, decision points, and outcomes to explain the strategic process comprehensively.
-
How to Use
Use in executive reports, business plans, investor pitch decks, and strategy presentations to explain project phases and decision-making checkpoints. Customize each stage box with activity names, responsible parties, and timelines to facilitate internal communication and investor persuasion.
-
Recommended For
CFOs, investment managers, business development professionals, strategic planning teams, and project managers presenting investment evaluation processes, project timelines, and organizational decision structures. Effective for startup fundraising, major project kickoffs, and executive board meetings.
-
Slide Structure
Two-slide set providing both light background and dark navy background versions. Each slide contains 4 sequential nodes (stages) connected by directional arrows, stage-specific icons, and text input areas. Formatted in 16:9 widescreen for optimal compatibility with modern presentation environments.
Related Products
-

Transport Icons and Flowcharts – Business Strategy
#Business Strategy #Operational Plan #Diagram
-

Sleek Presentation Template Emphasizing Business Context
#Business Strategy #Operational Plan #Technical Approach
-

Visualizing the IoT Service Process – Incorporating Business Strategy
#Business Strategy #Operational Plan #Diagram
-

Diagram Slide for Ship Operating System
#Business Strategy #Operational Plan #Marketing Plan and Strategy
