Blue Purple Annual Market Trends Slide
RJ0600107_13
- Last Update 07/19/2025
- File Size 0.3MB
- # of Slides 2
- File Format PPTX
- Slide Ratio 16:9
- Color
Keywords
About the Product
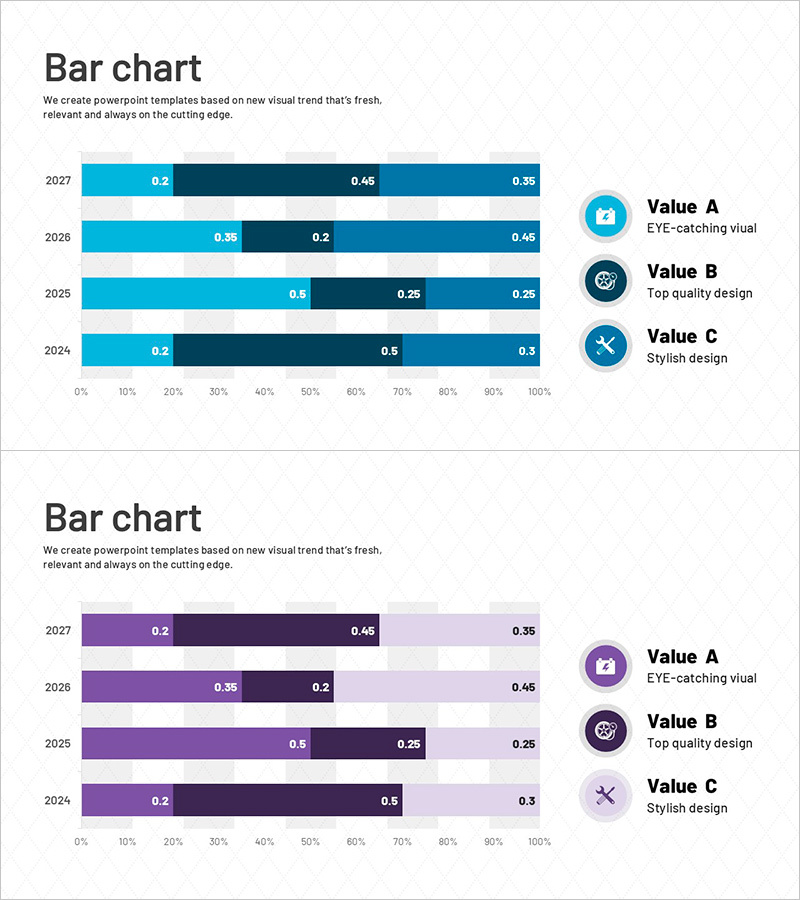
A horizontal bar chart PowerPoint slide that visualizes annual market trends across four years (2024–2027) with three data series. The chart uses a dual-color design: blue theme (light blue, dark blue, pale blue) and purple theme (light purple, dark purple, pale purple) to represent different data categories. Each bar displays numeric labels for precise data comparison. The 2-slide set provides both color versions, allowing you to match your presentation's visual tone. Ideal for business analysis reports, market research presentations, annual performance reviews, and executive briefings that require clear year-over-year trend analysis.
Usage Points
-
Main Usage
The primary purpose is to clearly compare and visualize year-over-year market trend data. By displaying four years of data across three series simultaneously, the chart enables viewers to identify trends, patterns, and differences between categories at a glance. Numeric labels ensure accurate data communication.
-
How to Use
Use this slide in market research reports, quarterly or annual performance presentations, and executive briefings to illustrate metrics such as market share, revenue trends, customer satisfaction scores, or competitive positioning. The blue version conveys trust and stability, making it suitable for corporate and financial presentations. The purple version emphasizes creativity and innovation, ideal for tech and creative industry pitches.
-
Recommended For
Marketing managers, executives, data analysts, management consultants, financial officers, and business strategists presenting market insights. Particularly effective in annual business plan presentations, investor relations meetings, board-level reports, and internal performance reviews.
-
Slide Structure
Slide 1: Blue theme with light blue, dark blue, and pale blue horizontal bars representing three data series across 2024–2027. Slide 2: Purple theme with light purple, dark purple, and pale purple bars in identical layout. Both slides include legend, numeric value labels on each bar segment, and 0–100% horizontal axis scale.
Related Products
-

Business Analysis Pie Chart
#Product/Service Introduction #Market and Competitor Analysis #Graph
-

Proportional Graph by Meat Part – Market Analysis Insights
#Market and Competitor Analysis #Diagram #Graph
-

Green Yellow Comparison Graph - Insights through Data Visualization
#Graph
-

Business Analysis with Doughnut Chart – Dawn City Theme
#Product/Service Introduction #Business Introduction #Diagram
