Children's Education Area Graph – Market Trends Analysis
RJ0500008_18
- Last Update 06/09/2025
- File Size 3.6MB
- # of Slides 2
- File Format PPTX
- Slide Ratio 16:9
- Color
Keywords
About the Product
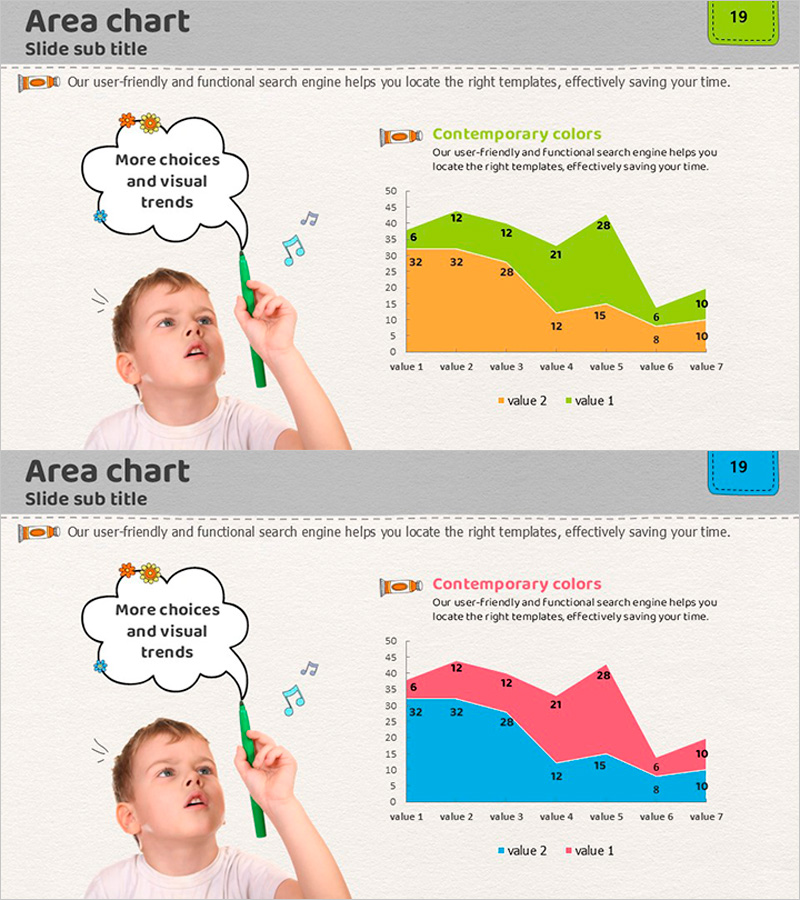
A professional area chart PowerPoint slide optimized for market analysis and competitive comparison. This presentation slide features a dual-color area graph with orange and green data series, effectively visualizing data trends across seven time periods or categories. The left side includes a text box for key messages and insights, while the right side displays the interactive area chart with labeled data points. Ideal for educational market analysis, competitive benchmarking, future outlook presentations, and business intelligence reports. The slide supports easy customization of data values, axis labels, and legend information for your specific presentation needs.
Usage Points
-
Main Usage
This slide is designed to compare two data series over time using an area chart format, making it ideal for presenting market trends, competitive performance, and future projections. The stacked area visualization allows audiences to quickly grasp relative proportions and changes in trends, while the accompanying text area enables you to highlight key insights and strategic implications of the data.
-
How to Use
Enter your analysis title or key message in the left text box labeled 'More choices and visual trends.' Input your actual data values into the seven data points (value 1 through value 7) on the area chart, and the visualization will automatically update. Customize the legend labels, axis titles, and color scheme to match your presentation context and branding requirements.
-
Recommended For
This slide is recommended for market analysis sections in marketing plans, business reports, investor presentations (IR), and executive briefings. It works particularly well for educational industry analysis, competitive benchmarking, market share evolution, and trend forecasting. Also suitable for government policy reports, academic presentations, and consulting proposals.
-
Slide Structure
The slide features a two-column layout with a text area on the left (for title and description) and an area chart on the right. The chart displays two data series in orange and green across seven data points, with numerical labels at each point. A title section at the top and legend at the bottom complete the professional analytical slide design.
Related Products
-

Weather Impact on Travel Analysis - Market Outlook Graph
#Market and Competitor Analysis #Graph #Other
-

Curved Hill Shape Graph – Market Trend and Growth Analysis
#Market and Competitor Analysis #Graph #Other
-

Pink Navy Distribution Curve Graph – Effective Solutions for Market Analysis
#Market and Competitor Analysis #Graph #Other
-

Market Analysis Area Graph – Risk Reduction
#Market and Competitor Analysis #Graph #Other
