Reuse Cycle Diagram Slide – Sustainability and Social Responsibility
RJ0600105_15
- Last Update 07/19/2025
- File Size 7MB
- # of Slides 2
- File Format PPTX
- Slide Ratio 16:9
- Color
Keywords
- #Content-Based Slides
- #Design-Based Slides
- #Operational Plan
- #Corporate Social Responsibility
- #Diagram
- #Risk Management
- #Sustainability Programs
- #Flow
- #Cluster
- #Circular Flow
- #Chain Diagram
- #16:9
- #cycle diagram PowerPoint
- #4-step circular process slide
- #sustainability diagram template
- #social responsibility cycle PPT
- #circular flow PowerPoint slide
- #diagram slide template download
- #how to create cycle diagram in PowerPoint
About the Product
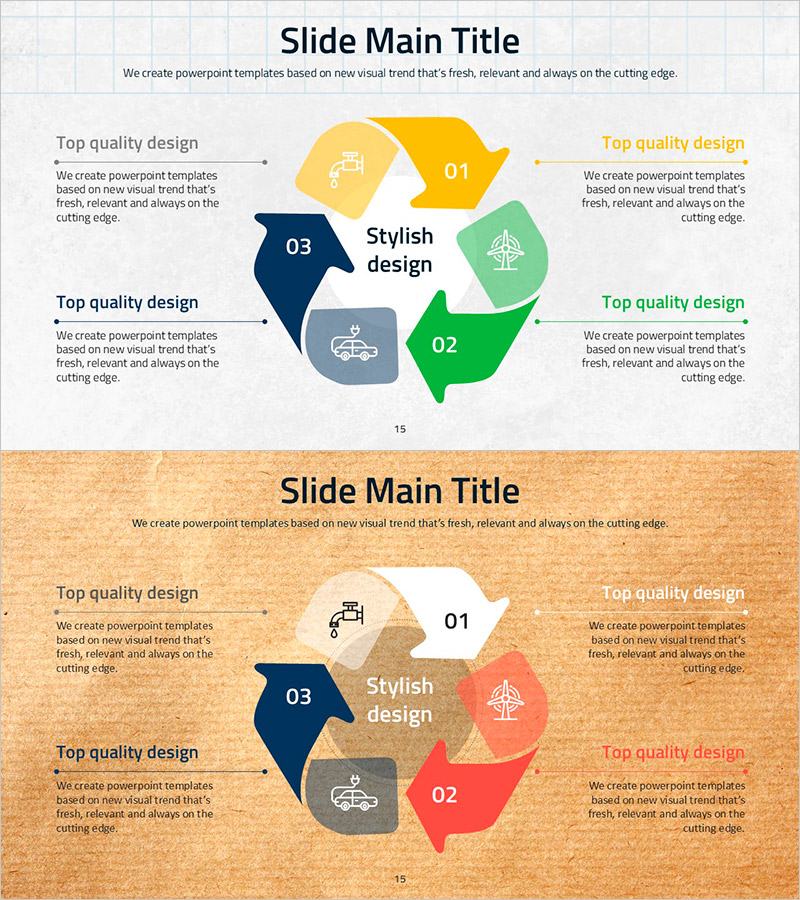
A 4-step circular diagram PowerPoint slide designed to visualize sustainability and social responsibility concepts. Arrow-shaped nodes in yellow, green, navy, and gray connect clockwise to represent cyclical processes intuitively. Each stage features icons and text areas for clearly communicating business concepts such as reuse, circular economy, operational planning, and risk management. The 2-slide set includes both white and beige background versions, allowing you to match your presentation's design tone. Fully editable in PPTX format for immediate customization.
Usage Points
-
Main Usage
Breaks down circular processes such as sustainability, circular economy, social responsibility, and operational planning into 4 stages to clearly communicate sequential flow to your audience. Icons and text areas in each node emphasize key concepts, while arrow connections intuitively express cause-and-effect relationships between stages.
-
How to Use
Use in strategy, operational planning, and risk management sections of business plans, reports, and proposals to explain circular processes. Click each node to edit text and colors; add or remove nodes as needed. Choose between white or beige background versions to match your presentation's design aesthetic.
-
Recommended For
Ideal for corporate presentations on sustainability and ESG initiatives, government and NGO reports explaining circular economy and recycling processes, and manufacturing or service company materials visualizing operational cycles and quality management. Effective for presentations to executives, employees, and external stakeholders.
-
Slide Structure
Four arrow-shaped nodes arranged clockwise around central 'Stylish design' text. Each node contains a number (01–04), icon, and text area, with arrows connecting nodes to show circular flow. Includes 2 slides: white background and beige background versions.
Related Products
-

Tree Circulation Connection Diagram
#Operational Plan #Technical Approach #Diagram
-

Square Circulatory System Diagram – Enhancing Operational Efficiency
#Operational Plan #Diagram #Business Processes
-

Introducing SUV Features – Enhancing Ride Quality in Operations Planning
#Operational Plan #Technical Approach #Diagram
-

Marriage Conflict Diagrams – Effective Solutions
#Operational Plan #Diagram #Risk Management
