Flower and Market Comparison Analysis Chart – Effective Business Strategy
RJ0600104_5
- Last Update 07/19/2025
- File Size 0.6MB
- # of Slides 2
- File Format PPTX
- Slide Ratio 16:9
- Color
Keywords
- #Content-Based Slides
- #Design-Based Slides
- #Business Strategy
- #Market and Competitor Analysis
- #Graph
- #Achievements
- #Competitor Analysis
- #Column
- #Other
- #Segmented Column
- #Area Chart
- #16:9
- #area chart PowerPoint
- #area graph slide template
- #2-series comparison chart
- #market analysis presentation
- #competitive analysis slide
- #data comparison PowerPoint template
About the Product
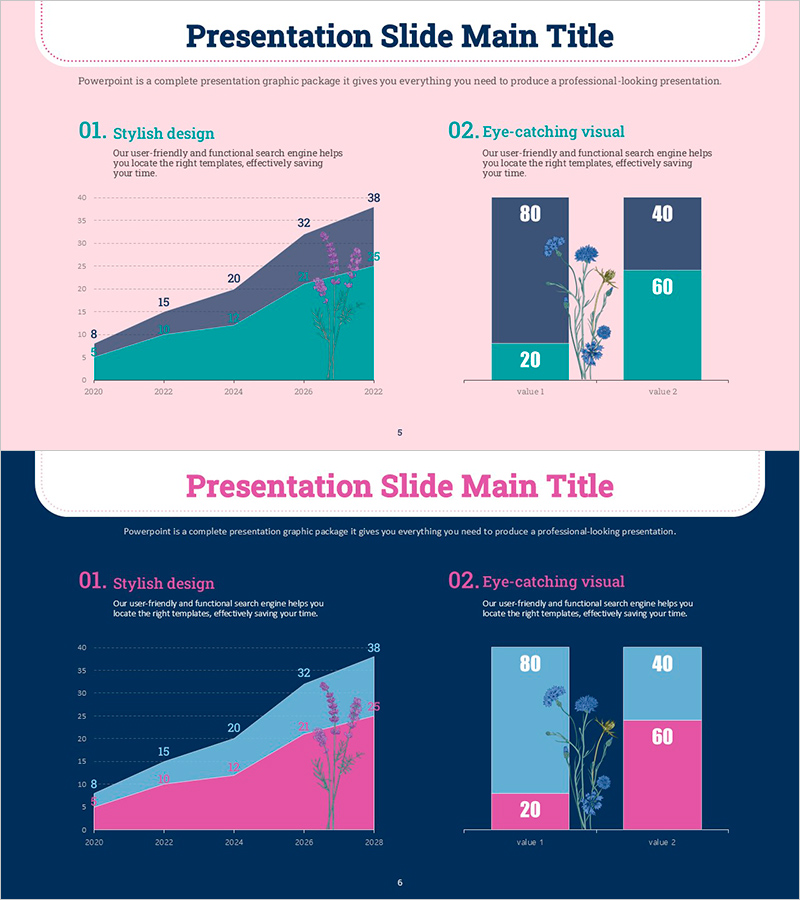
A PowerPoint area chart slide comparing flower and market data across two series with pink and teal gradient visualization. This presentation slide effectively displays numerical changes over time and relative magnitude comparison between two items. The 16:9 widescreen format includes 2 slides ready for business strategy, market analysis, and competitive comparison presentations. All chart data is fully editable, allowing customization for various comparative analysis topics and business contexts.
Usage Points
-
Main Usage
Visualize numerical changes of two items over time while emphasizing relative size comparison. Ideal for displaying market size trends, competitive performance benchmarking, business segment revenue evolution, and other comparative analysis data in professional presentations.
-
How to Use
Place this chart in the market analysis section of business strategy presentations, competitive analysis pages, or quarterly/annual performance comparison slides. Maintain the pink and teal color scheme or adapt to corporate brand colors for consistent visual identity throughout your presentation.
-
Recommended For
Marketing professionals, business planners, financial analysts, and executives presenting data-driven insights. Suitable for quarterly earnings reports, new business proposals, market research findings, investor presentations, and strategic planning meetings.
-
Slide Structure
2-slide set featuring area charts with dual-series data visualization. First slide displays pink and teal gradient area chart (2020–2028 timeline, 8 data points). Second slide presents the same structure with dark blue and pink color variation. Each slide includes title, descriptive text, and legend—all elements are fully editable and customizable.
Related Products
-

Vertical Bar Chart Slide | Data Comparison & Analysis PPT
#Business Strategy #Market and Competitor Analysis #Graph
-

Subdivision Vertical Graph Comparison Type – Optimal for Business Strategy Analysis
#Business Strategy #Market and Competitor Analysis #Graph
-

Gradient Theme Area Diagram – Market and Competitor Analysis
#Market and Competitor Analysis #Diagram #Graph
-

Business Promotion Strategy PowerPoint Template
#Business Strategy #Technical Approach #Market and Competitor Analysis
