Camera Comparison Competitive Analysis Slide - Data-Driven Strategy
RJ0500021_6
- Last Update 06/12/2025
- File Size 0.5MB
- # of Slides 2
- File Format PPTX
- Slide Ratio 16:9
- Color
Keywords
About the Product
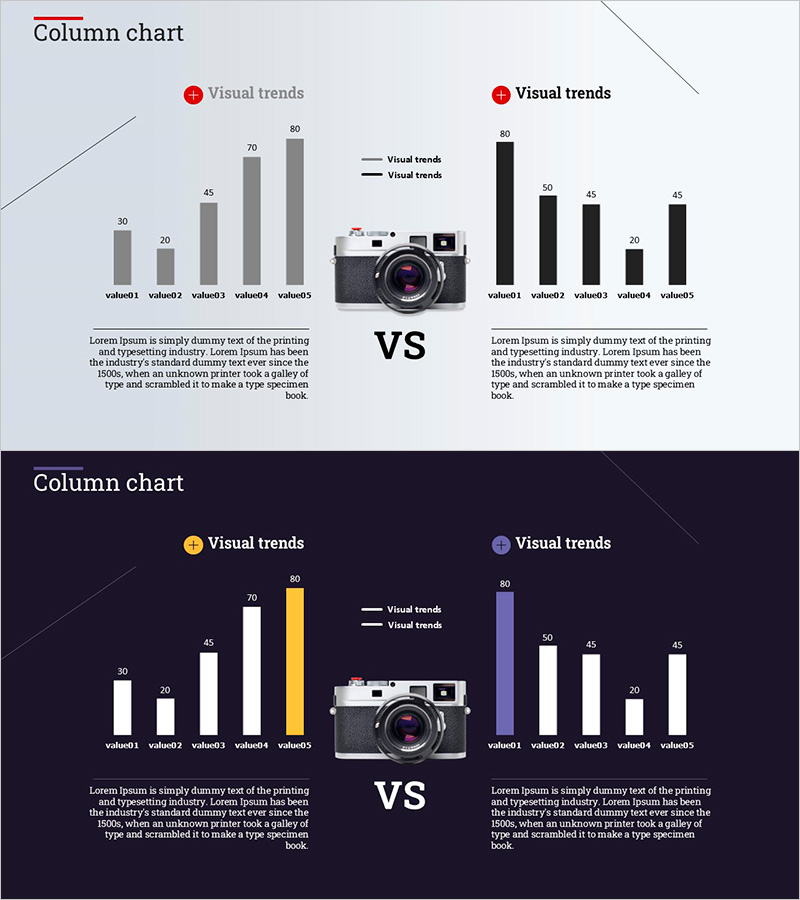
A column chart PowerPoint slide designed for product comparison and competitive analysis featuring camera equipment. This 2-slide presentation showcases five data points using vertical bar graphs with light and dark background options. Each slide layout positions an ascending column chart on the left, a product image in the center, and comparative data on the right, effectively communicating market trends and competitive positioning. Ideal for marketing reports, product presentations, and market analysis pitches that require data-driven visual storytelling.
Usage Points
-
Main Usage
Designed to visually represent product comparison and market competitive analysis through numerical data. The vertical bar graphs effectively display performance metrics, pricing, market share, and other comparative data across camera brands and electronic products, paired with product imagery for persuasive market positioning.
-
How to Use
Apply this template to market analysis sections in marketing reports, competitive comparison pages in product brochures, and market overview slides in investor presentations. Replace the bar chart values and legends with your own data, and substitute product images to customize for different industries and product categories.
-
Recommended For
Marketing professionals, product managers, sales executives, market analysts, and business development teams. Particularly valuable for B2B competitive analysis, consumer product positioning, and technology performance comparison presentations.
-
Slide Structure
Each slide features three distinct zones: a left-side ascending column chart displaying five data points (value01 through value05) on a 0-80 scale, a center product image with 'VS' text separator, and a right-side comparative chart with identical structure. Two design variations provided—light tone with gray background and dark tone with black background—including legend and descriptive text areas.
Related Products
-

Gradient PPT Wide Template Vertical Bar Comparison Graph
#Market and Competitor Analysis #Graph #Competitor Analysis
-

3 Competitive Advantage Graphs – Market and Competitor Analysis
#Market and Competitor Analysis #Graph #Competitor Analysis
-

Comparative Analysis Graph – Market and Competitor Analysis
#Market and Competitor Analysis #Graph #Competitor Analysis
-

Data Analysis with Zombie Hand Graph Visualization
#Market and Competitor Analysis #Graph #Competitor Analysis
