Competitor Comparison Analysis Bar Graph
RJ0300059_13
- Last Update 05/04/2025
- File Size 0.8MB
- # of Slides 2
- File Format PPTX
- Slide Ratio 16:9
- Color
Keywords
- #Content-Based Slides
- #Design-Based Slides
- #Market and Competitor Analysis
- #Graph
- #Competitor Analysis
- #Competitive Advantage
- #Column
- #Column Chart
- #16:9
- #horizontal bar chart PowerPoint
- #competitor analysis comparison slide
- #bar graph template
- #competitive analysis chart PPT
- #how to create comparison chart in PowerPoint
About the Product
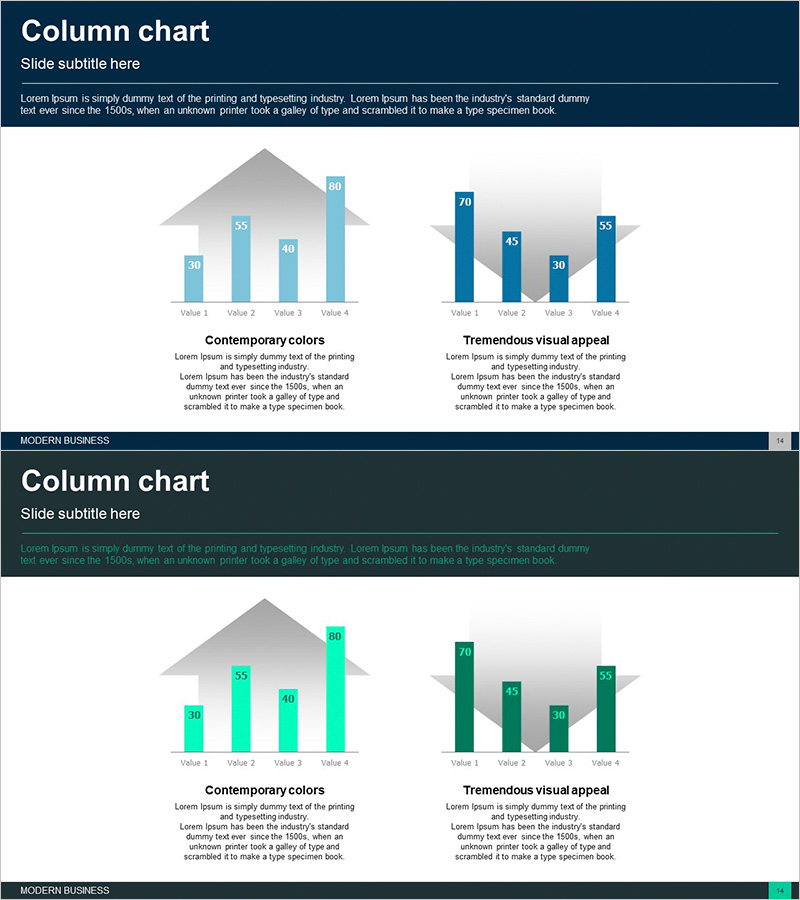
A horizontal bar chart PowerPoint slide designed for competitive analysis and comparative evaluation. The slide features two color schemes—light blue and dark blue—enabling side-by-side comparison of four data items. Numeric labels appear above each bar for clear data readability, while arrow background elements visually emphasize competitive relationships. This presentation template is ready to use in marketing strategy development, market analysis reports, business proposals, and competitive positioning presentations.
Usage Points
-
Main Usage
Visualize competitive analysis and comparative evaluation through numerical data. The 4-item left-right contrast layout clearly expresses competitive relationships, while light and dark blue color contrast emphasizes differentiation. Effectively communicates competitive advantage in marketing strategy, market analysis, and business proposal presentations.
-
How to Use
Replace bar values with your company and competitor data for immediate use. Horizontal orientation ensures item names are clearly visible, enhancing audience comprehension during presentation. The 2-slide structure allows the same data to be presented in different color combinations, enabling flexible selection based on presentation context.
-
Recommended For
Recommended for marketing managers, strategic planning teams, and sales executives presenting competitive analysis results. Ideal for market research reports, business proposals, investor pitch decks, and quarterly performance analysis presentations where competitive positioning explanation is essential.
-
Slide Structure
2-slide set. Each slide features an arrow background with two sets of 4-item horizontal bar charts (left: light blue, right: dark blue). Numeric labels positioned at bar ends. Bottom section includes descriptive text areas for 'Contemporary colors' and 'Tremendous visual appeal' annotations.
Related Products
-

Competitor Analysis Bar Graph - Visualizing Market Status
#Market and Competitor Analysis #Graph #Competitor Analysis
-

Color Highlight Vertical Bar Graph – Market Competition Analysis
#Market and Competitor Analysis #Graph #Competitor Analysis
-

Comparative Analysis 3D Cylinder Bar Graph – Market and Competitor Analysis
#Market and Competitor Analysis #Graph #Competitor Analysis
-

Online Presentation Template Comparison Chart – Visualizing Competitive Analysis
#Market and Competitor Analysis #Graph #Competitor Analysis
