Effective Donut Chart Slide for Travel Decisions
RJ0600102_8
- Last Update 07/18/2025
- File Size 0.8MB
- # of Slides 2
- File Format PPTX
- Slide Ratio 16:9
- Color
Keywords
- #Content-Based Slides
- #Design-Based Slides
- #Market and Competitor Analysis
- #Marketing Plan and Strategy
- #Graph
- #Market Share
- #Target Market Strategy
- #Circles
- #Doughnut Chart
- #16:9
- #donut chart PowerPoint
- #donut graph slide template
- #travel decision chart
- #pie chart PowerPoint template
- #proportion visualization slide
- #how to create donut chart in PowerPoint
About the Product
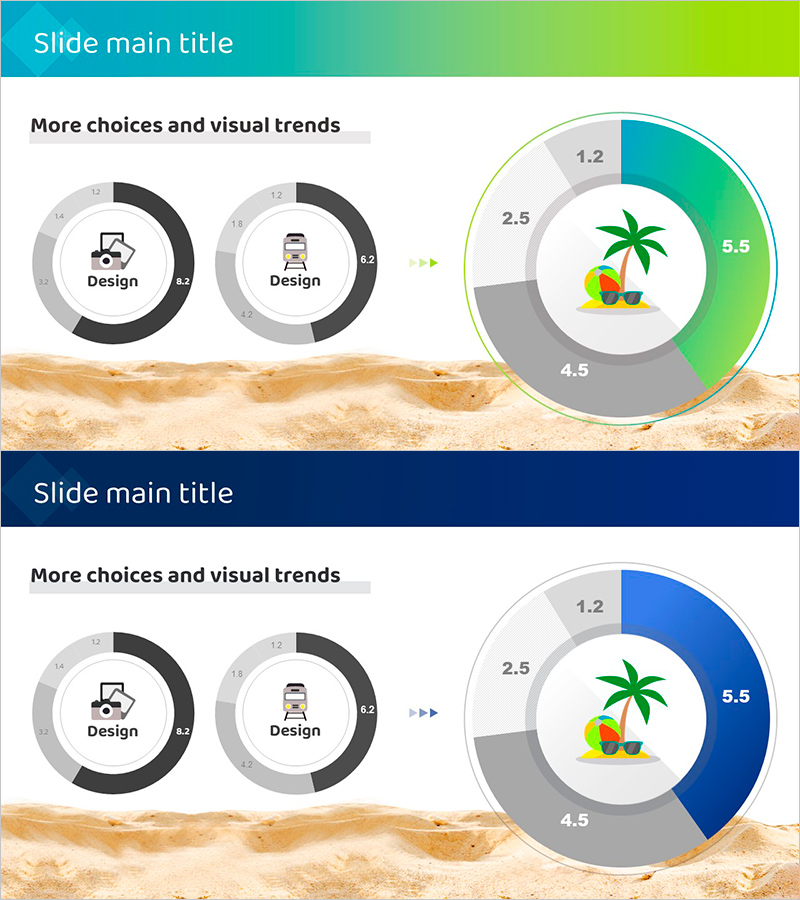
A donut chart PowerPoint slide designed to visualize travel decision-making factors with four color-coded segments. The central icon (palm tree, sunglasses, beach scene) anchors the composition while each segment displays proportional data in turquoise, green, and gray tones. This presentation template includes two layout variations with gradient backgrounds, making it ideal for travel agencies, tourism marketing teams, and travel content creators. The 16:9 widescreen format with 2 slides allows immediate data entry and presentation delivery.
Usage Points
-
Main Usage
Visualize key travel decision factors (budget, schedule, destination, companions) as proportional segments. The central icon clearly communicates the travel theme, making this ideal for tourism boards, travel agencies, and marketing departments presenting strategic analysis.
-
How to Use
Replace segment labels and numbers with your travel decision categories and adjust colors as needed. Choose between two background color schemes (turquoise or navy) to match your presentation style. The central icon can be swapped with alternative travel-related imagery.
-
Recommended For
Travel agency marketing teams, tourism boards, travel bloggers, hotel chains, and airline planning departments analyzing customer preferences, travel purposes, and seasonal demand. Also suitable for tourism education programs and hospitality training presentations.
-
Slide Structure
Four-segment donut chart with central travel icon (palm tree, sunglasses, beach illustration). Each segment displays numerical values (1.2, 2.5, 4.5, 5.5) with editable labels. Turquoise-to-green gradient header, sand texture background. Two color variations provided (turquoise and navy blue).
Related Products
-

Travel Guide Business Goal Market Strategy Donut Chart – Market Share Analysis
#Market and Competitor Analysis #Marketing Plan and Strategy #Graph
-

Russia, Turkey, Japan Business Development Status – Donut Chart
#Market and Competitor Analysis #Marketing Plan and Strategy #Graph
-

Doughnut Chart Visualizing Current Status of 3D Printing Technology Development
#Product/Service Introduction #Market and Competitor Analysis #Graph
-

Navigation App Market Share Graph Analysis – Effective Data Visualization
#Market and Competitor Analysis #Graph #Market Share
