Russia, Turkey, Japan Business Development Status – Donut Chart
RJ0400060_20
- Last Update 06/03/2025
- File Size 0.7MB
- # of Slides 2
- File Format PPTX
- Slide Ratio 16:9
- Color
Keywords
- #Content-Based Slides
- #Design-Based Slides
- #Market and Competitor Analysis
- #Marketing Plan and Strategy
- #Graph
- #Other
- #Market Share
- #Target Market Strategy
- #Circles
- #Doughnut Chart
- #16:9
- #donut chart PowerPoint
- #pie chart slide template
- #market share comparison
- #business development presentation
- #multi-country comparison chart
- #how to create donut chart in PowerPoint
About the Product
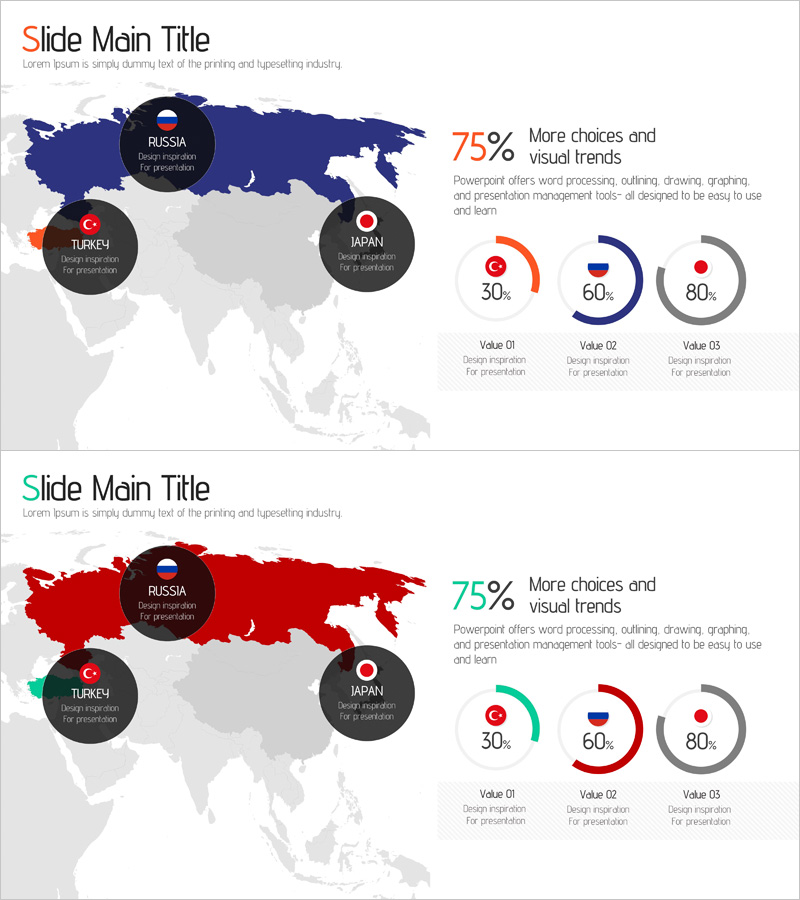
A PowerPoint slide deck visualizing business development status across Russia, Turkey, and Japan using donut chart design. The orange and navy dual-tone color scheme enables quick comparison of market share, growth rates, and strategic value for each country. Country icons and text labels are positioned in the center of each donut chart to enhance information clarity, while percentage gauges on the right display additional metrics. The 2-slide set includes color variations (navy-orange and red-turquoise versions) for flexible adaptation to presentation context and brand guidelines. Delivered in 16:9 widescreen PPTX format, fully editable and ready to use immediately.
Usage Points
-
Main Usage
Ideal for international business development strategy presentations where simultaneous comparison of market share, growth rates, and strategic importance across multiple countries is required. The center space of each donut chart accommodates country-specific icons or key metrics, achieving both information hierarchy and visual emphasis.
-
How to Use
Apply to business development team market entry strategy presentations, executive reports, and investor pitch decks within the market analysis section. Simply replace chart colors and numerical values with actual data. The 2-slide format allows selection of color variations to match presentation tone and audience expectations.
-
Recommended For
International business development managers, marketing strategy teams, corporate planning departments, and executives overseeing global market expansion. Particularly effective for multi-country comparative analysis, regional performance reporting, and global expansion strategy presentations.
-
Slide Structure
2-slide composition with world map background. Each slide features 3 donut charts (Russia, Turkey, Japan) with country icons and text labels centered within each chart. Right side displays 3 percentage gauges (30%, 60%, 80%) as supplementary metrics. Slide 1 uses orange-navy dual tone; Slide 2 provides red-turquoise color variation for flexible presentation adaptation.
Related Products
-

Global Map and Donut Chart – Visualizing Market Share
#Company Introduction #Market and Competitor Analysis #Graph
-

Market Share Analysis with Doughnut Chart – Visualize Data and Strategy
#Market and Competitor Analysis #Graph #Other
-

Doughnut Chart Slide Visualizing Market Share by Country
#Market and Competitor Analysis #Graph #Other
-

Doughnut Chart Visualizing Market Share by Exercise
#Business Introduction #Market and Competitor Analysis #Graph
