Travel Guide Business Goal Market Strategy Donut Chart – Market Share Analysis
RJ0600063_16
- Last Update 07/07/2025
- File Size 5.1MB
- # of Slides 2
- File Format PPTX
- Slide Ratio 16:9
- Color
Keywords
- #Content-Based Slides
- #Design-Based Slides
- #Market and Competitor Analysis
- #Marketing Plan and Strategy
- #Graph
- #Market Share
- #Target Market Strategy
- #Circles
- #Doughnut Chart
- #16:9
- #donut chart PowerPoint slide
- #pie chart template
- #market share analysis PPT
- #ratio visualization slide
- #donut graph download
- #how to create donut chart in PowerPoint
About the Product
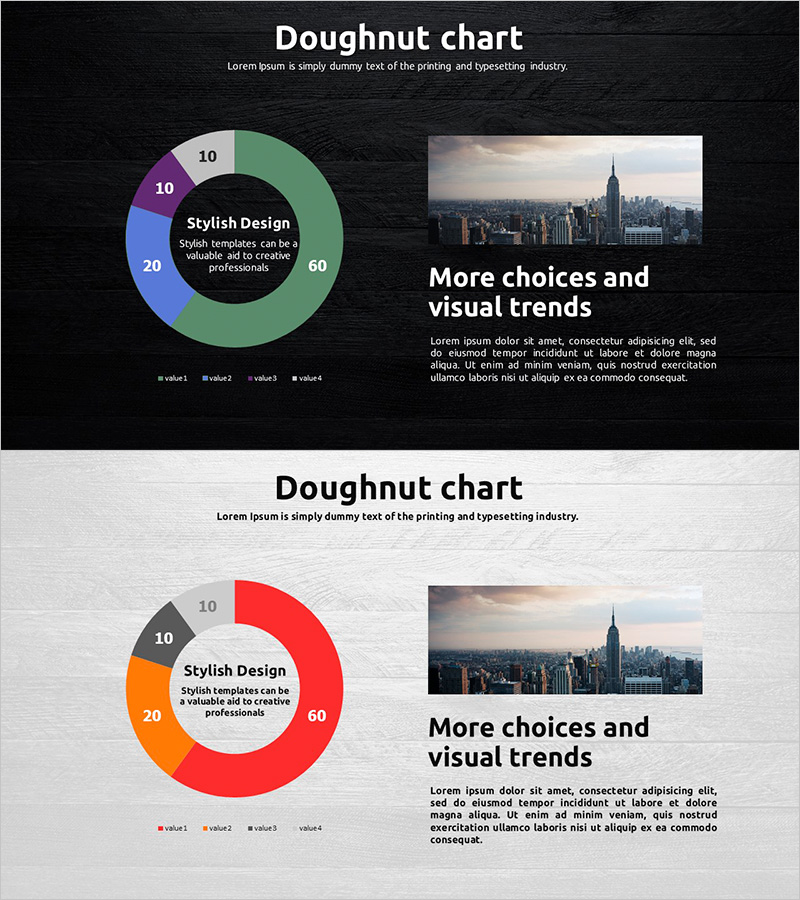
A 2-slide PowerPoint presentation featuring donut chart slides for visualizing market share and business objectives. The design places a central text area within the donut ring and divides the chart into 4 colored segments to represent data proportions. Dark backgrounds (black and charcoal) contrast with vibrant segment colors (green, blue, purple, gray) to enhance information clarity. Immediately applicable for travel guide businesses, tourism presentations, and market strategy reports.
Usage Points
-
Main Usage
Optimized for visualizing market share, sales ratios, customer composition, and budget allocation as part-to-whole relationships. The central ring area accommodates key messages or brand names, creating strong emphasis and visual hierarchy.
-
How to Use
Apply in travel business pitches, marketing strategy reports, and market analysis presentations to compare competitors, analyze customer segments, and explain revenue composition. Edit segment values and labels to match your actual data and customize colors as needed.
-
Recommended For
Marketing managers, business planners, consultants, and tourism professionals presenting market conditions and strategies to executives, investors, and clients. Ideal for quarterly performance reports, new business proposals, and market entry strategy presentations.
-
Slide Structure
2-slide set: Slide 1 features dark background with 4-segment donut graph (green, blue, purple, gray segments), central text box, and image area on the right. Slide 2 offers light background with identical donut structure and color variation (red, orange, gray segments). 16:9 widescreen format, PPTX file type.
Related Products
-

Effective Donut Chart Slide for Travel Decisions
#Market and Competitor Analysis #Marketing Plan and Strategy #Graph
-

Russia, Turkey, Japan Business Development Status – Donut Chart
#Market and Competitor Analysis #Marketing Plan and Strategy #Graph
-

Doughnut Chart Visualizing Current Status of 3D Printing Technology Development
#Product/Service Introduction #Market and Competitor Analysis #Graph
-

Navigation App Market Share Graph Analysis – Effective Data Visualization
#Market and Competitor Analysis #Graph #Market Share
