Backpacking Traveler Trends Analysis Graph – Future of Travel Industry
RJ0600094_20
- Last Update 07/16/2025
- File Size 0.8MB
- # of Slides 2
- File Format PPTX
- Slide Ratio 16:9
- Color
Keywords
- #Content-Based Slides
- #Design-Based Slides
- #Technical Approach
- #Market and Competitor Analysis
- #Graph
- #Other
- #Future Development Roadmap
- #Market Status
- #16:9
- #travel trends analysis PowerPoint slide
- #market analysis graph PPT
- #travel industry chart presentation
- #area chart PowerPoint template
- #market overview slide deck
About the Product
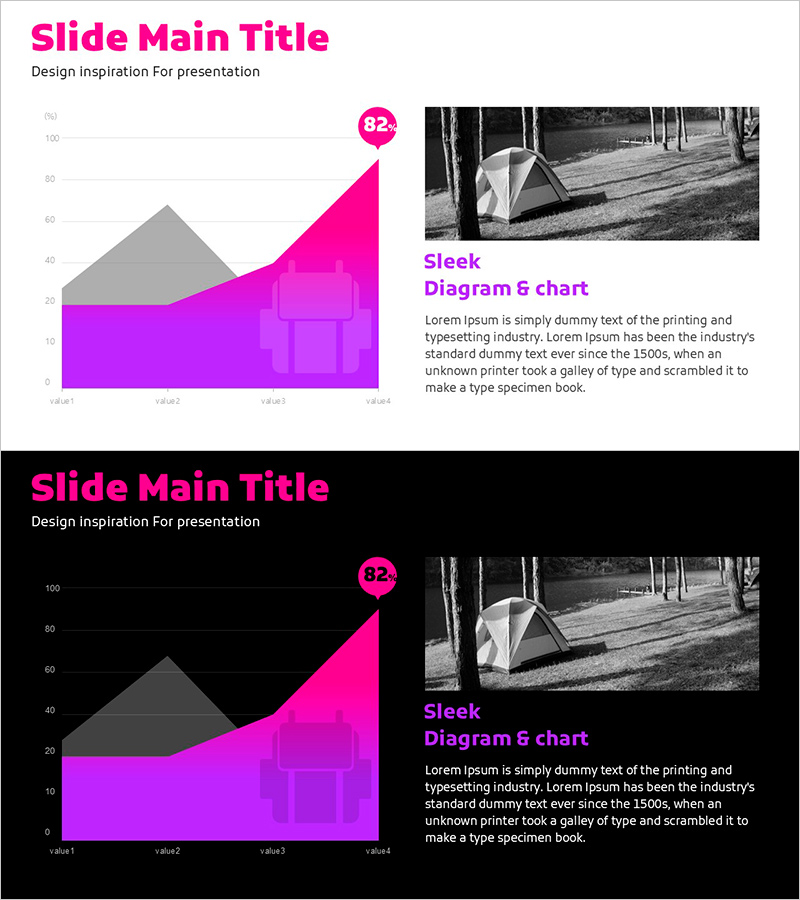
A 2-slide PowerPoint presentation visualizing backpacking traveler market trends. The design combines magenta and gray area charts to illustrate travel industry growth, enhanced with black-and-white imagery and a key data point (82%) to reinforce market credibility. This slide deck is ready to use in the market overview section of business presentations, investment proposals, and strategic reports for travel, hospitality, and tourism sectors.
Usage Points
-
Main Usage
Communicate travel and tourism market size evolution and growth trajectory with data-backed credibility. The stacked area chart structure enables audiences to grasp market dynamics over time at a glance, while highlighted data points emphasize key performance metrics and industry momentum.
-
How to Use
Insert into the market overview section of business plans, investment pitches, and market analysis reports to demonstrate industry growth potential. The contrast between black-and-white imagery and magenta charts directs audience attention, allowing you to reinforce market opportunity through verbal narrative paired with quantitative evidence.
-
Recommended For
Ideal for travel agencies, hotel chains, booking platforms, tourism boards, and travel-tech startups presenting to executives and investors. Market analysts, marketing professionals, and business development teams benefit when quantitatively validating industry trends and competitive positioning.
-
Slide Structure
Two-slide format with the first featuring a light background combining magenta and gray area charts, black-and-white imagery, and data callouts; the second replicates the chart structure on a dark background. Both slides include title, subtitle, chart area, image space, and numeric data points, allowing easy text customization and data updates.
Related Products
-

Blackboard Chalk Theme Market Analysis Graph – Creative Data Visualization
#Technical Approach #Market and Competitor Analysis #Graph
-

Battery Shape Vertical Bar Graph – Competitor Analysis
#Technical Approach #Market and Competitor Analysis #Graph
-

Weather Forecast Accuracy Probability Graph – A Tool for Market Analysis
#Business Introduction #Market and Competitor Analysis #Graph
-

Product Sales Status Chart – Effective Data Visualization
#Business Strategy #Market and Competitor Analysis #Diagram
