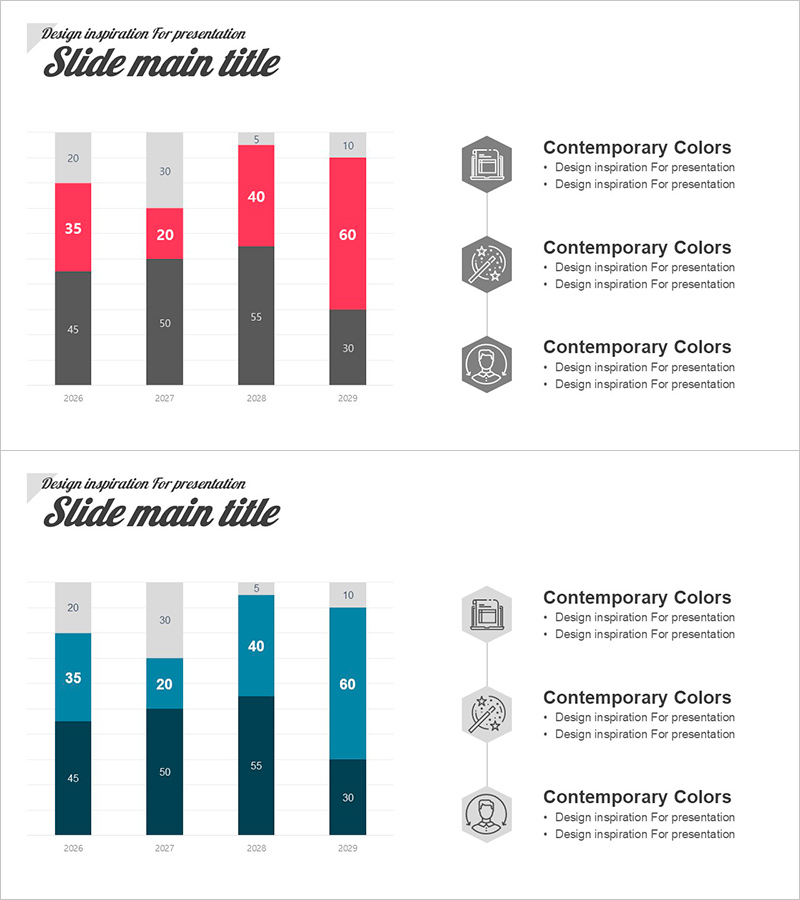
Vertical Bar Chart for Sales Growth – Emphasizing Business Performance
RJ0600098_20
- Last Update 07/17/2025
- File Size 0.2MB
- # of Slides 2
- File Format PPTX
- Slide Ratio 16:9
- Color
Keywords
About the Product
A vertical bar chart PowerPoint slide that visualizes sales growth from 2026 to 2029 across four years. Each bar is subdivided into 3-4 segments to clearly represent sales composition and breakdown. Two color variations are provided: pink and gray tones, and teal and black tones, allowing you to match your corporate branding. Three icon-labeled information points are positioned on the right side for additional context. This presentation slide effectively communicates growth narratives through data-driven storytelling in business performance reports, quarterly earnings presentations, and investor relations meetings.
Usage Points
-
Main Usage
Ideal for comparing year-over-year and quarterly revenue, profit, and sales volume data while emphasizing growth trends. The segmented bars simultaneously represent sales composition (new, existing, other) to convey both quantitative metrics and qualitative insights.
-
How to Use
Use in business performance reports, quarterly earnings presentations, investor relations meetings, and executive briefings to deliver compelling growth stories backed by data. Edit bar heights and color segments with actual figures for immediate deployment.
-
Recommended For
Finance and accounting teams presenting performance analysis, sales and marketing teams reporting achievements, executives conducting quarterly reviews, and investor relations professionals demonstrating growth potential. Particularly effective for data-driven decision-making organizations requiring credible communication.
-
Slide Structure
Four vertical bars representing years 2026-2029, each subdivided into 3-4 segments. Two color variations: pink/gray and teal/black schemes. Three hexagonal icons with text descriptions positioned on the right. 16:9 aspect ratio, 2-slide set.
Related Products
-

Construction Business Trend Graph of Office Buildings – Essential Template for Market Analysis
#Market and Competitor Analysis #Graph #Market Share
-

Natural Vertical Bar Segment Chart – A Key Tool for Market Analysis
#Business Strategy #Market and Competitor Analysis #Graph
-

Graph of Changes After a Healthy Diet – Data Visualization Template
#Market and Competitor Analysis #Graph #Market Analysis
-

Segmented Vertical Bar Graph for Automotive Market Trends
#Market and Competitor Analysis #Graph #Other
