Major Fruit Transaction Ratio – Market Analysis and Strategy
RJ0800007_17
- Last Update 08/01/2025
- File Size 0.5MB
- # of Slides 2
- File Format PPTX
- Slide Ratio 16:9
- Color
Keywords
- #Content-Based Slides
- #Design-Based Slides
- #Market and Competitor Analysis
- #Marketing Plan and Strategy
- #Other
- #Target Market
- #Distribution Strategy
- #Map
- #16:9
- #fruit transaction ratio PowerPoint slide
- #map chart presentation
- #market analysis pie chart
- #marketing strategy slide
- #global market data PPT
About the Product
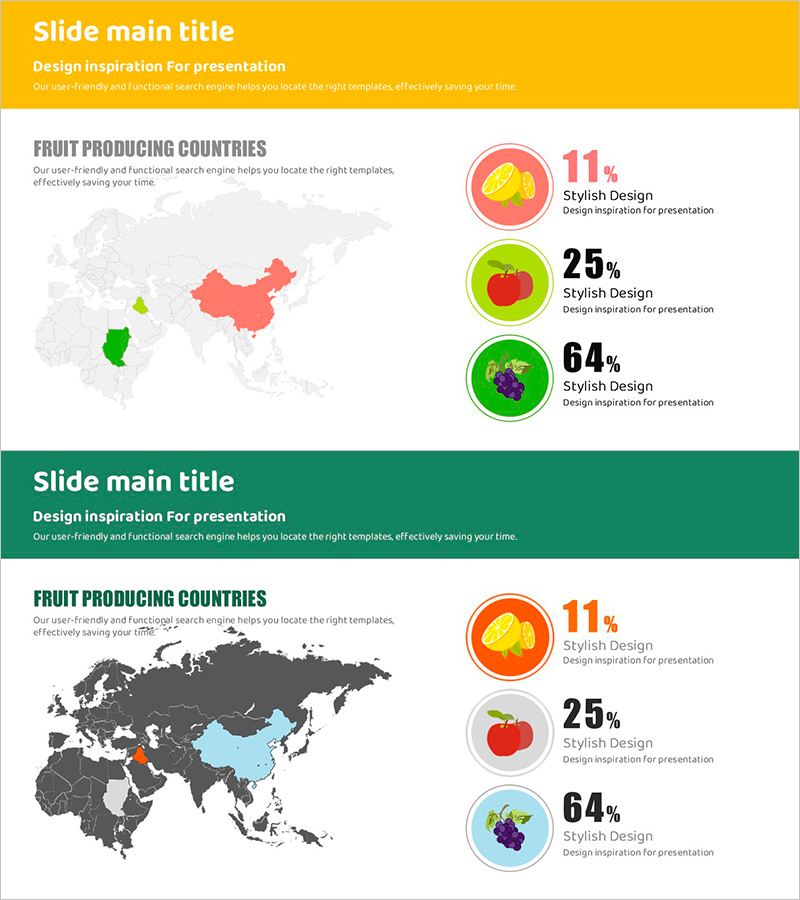
A PowerPoint slide that visualizes global fruit production using a world map and pie charts. The layout features a world map on the left with major producing countries highlighted by color, and three pie charts on the right displaying transaction ratios for different fruits. The yellow header and white background ensure clear data readability, with fruit icons and percentages positioned for immediate use in market analysis presentations. The 2-slide set uses alternating background colors (yellow and green) to create visual section breaks.
Usage Points
-
Main Usage
This slide combines a world map with pie charts to present regional fruit production and transaction ratios at a glance. It supports data-driven decision-making in market analysis, marketing strategy development, and investment proposals.
-
How to Use
Highlight major producing countries on the left map using color coding, then input transaction ratio data into the right pie charts. Customize the header text and descriptions to match your presentation context, then use as a background slide in the market analysis section.
-
Recommended For
Ideal for marketing managers, business development teams, investor presentations, and market research reports. Particularly suited for agricultural, food industry, import-export, and distribution companies presenting market overview information.
-
Slide Structure
The 2-slide set features a colored header (yellow or green) with title and subtitle areas, a world map on the left with 3–5 country highlight zones, and three pie charts on the right with icons, percentages, and labels. Total text input areas: 2 headers, 1 description, 3 chart labels (6 editable fields).
Related Products
-

Map of Enlightenment Period – Template for Market and Competitor Analysis
#Market and Competitor Analysis #Marketing Plan and Strategy #Text Box
-

World Map Data Slide | Regional Statistics Visualization PPT
#Market and Competitor Analysis #Marketing Plan and Strategy #Other
-

Trend Color Wide Template – Market and Distribution Strategy Analysis
#Market and Competitor Analysis #Marketing Plan and Strategy #Other
-

Worldwide Marketing Strategy Visualized on Map
#Market and Competitor Analysis #Marketing Plan and Strategy #Other
