Sequential Process Diagram Slide | Step-by-Step Flow PPT
RJ0600098_17
- Last Update 02/17/2025
- File Size 0.2MB
- # of Slides 2
- File Format PPTX
- Slide Ratio 16:9
- Color
Keywords
- #Content-Based Slides
- #Design-Based Slides
- #Business Strategy
- #Diagram
- #Implementation Framework
- #Flow
- #Linear Flow
- #16:9
- #sequential process diagram
- #step-by-step flow PowerPoint
- #trapezoid diagram slide
- #process visualization PPT
- #business procedure diagram
- #strategic roadmap template
- #how to create process flow in PowerPoint
About the Product
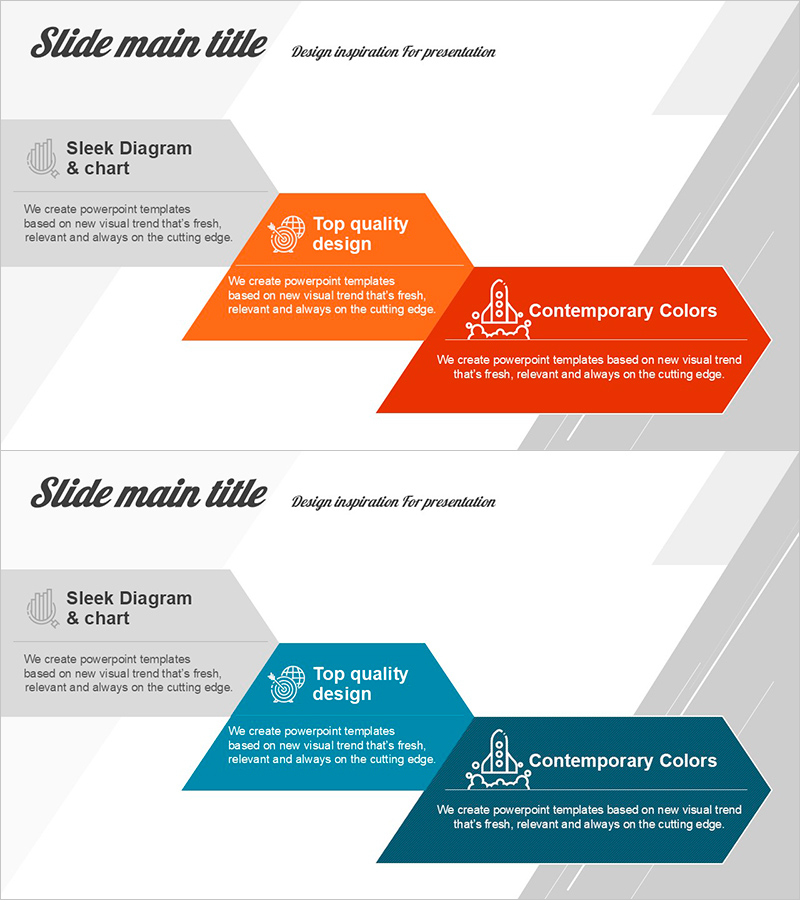
A PowerPoint slide featuring a 3-step sequential process diagram using trapezoid shapes that flow from left to right. The design employs an orange-to-red gradient color scheme to clearly visualize each stage of progression, with icons and text areas in each trapezoid for describing business procedures, strategic roadmaps, and project phases. Available in 2-slide PPTX format with 16:9 aspect ratio, fully editable and ready for immediate use in corporate presentations, training materials, and process documentation.
Usage Points
-
Main Usage
Visualize project phases, business workflows, strategic execution roadmaps, and product development procedures in a clear 3-step sequential format. Helps audiences understand linear progression and stage-by-stage advancement with visual clarity and logical flow.
-
How to Use
Enter stage names, descriptions, and responsible parties in the text areas within each trapezoid shape. Replace icons to reflect the characteristics of each phase. Present from left to right during your talk so the audience follows the sequential progression intuitively.
-
Recommended For
Project managers, strategy planners, operations specialists, trainers, and consultants who need to explain workflows or strategic execution phases. Suitable for business plans, proposals, training materials, management reports, and process improvement presentations.
-
Slide Structure
2-slide deck with 3 trapezoid shapes arranged horizontally from left to right on each slide, connected by arrows to show sequential flow. First slide uses orange gradient tones; second slide uses deep red tones to emphasize stage differentiation through color variation.
Related Products
-

Online Presentation Template Diagram7 – Visualizing Business Strategy
#Business Strategy #Diagram #Business Direction
-

Camera Aperture Diagram – The Beginning of Entry
#Business Strategy #Operational Plan #Diagram
-

Triangle Pattern Template Diagram – Visualizing Business Strategy
#Business Strategy #Business Management #Diagram
-

Visual Slide of 4-Step Process
#Business Strategy #Business Management #Diagram
