Data Visualization with Bar Chart – A Blueprint of Modern Design
RJ0600098_15
- Last Update 07/17/2025
- File Size 0.1MB
- # of Slides 2
- File Format PPTX
- Slide Ratio 16:9
- Color
Keywords
About the Product
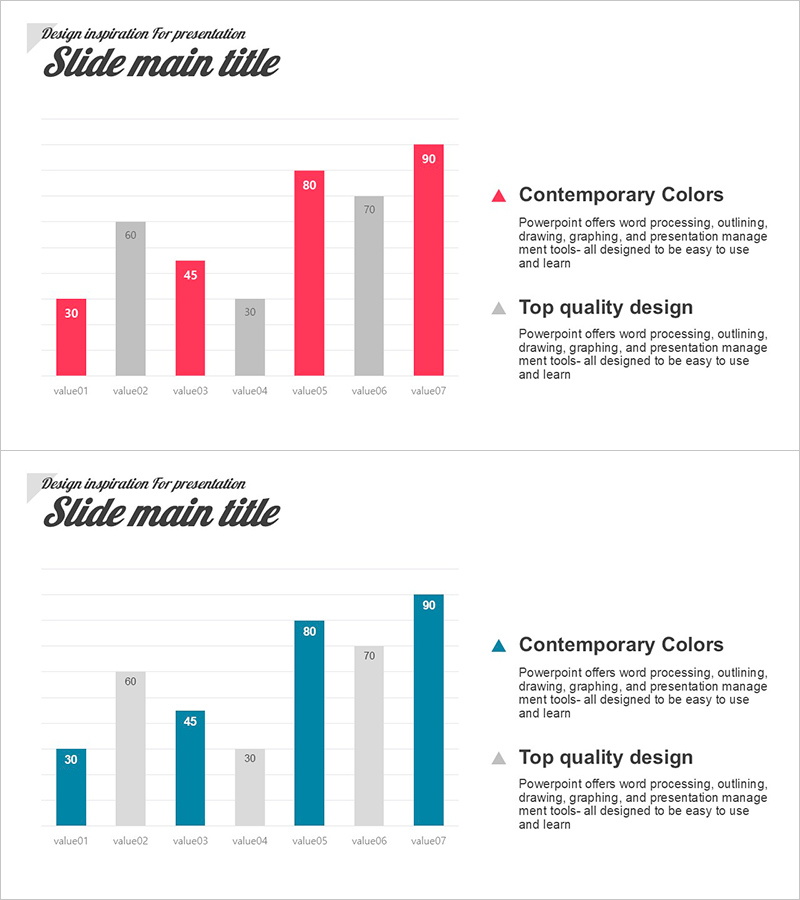
This free PowerPoint slide features a grouped vertical bar chart with two color variants: red-and-gray or teal-and-gray. It allows side-by-side comparison of two data series across seven categories, making it ideal for market analysis, performance reports, competitor benchmarking, and financial presentations. The two-column layout places the bar chart on the left and two descriptive text blocks with triangle icons on the right, providing both visual data and contextual explanation in a single slide. A white background with horizontal grid lines ensures clean readability across all presentation contexts. Simply replace the values and labels to adapt this PPT slide to any business deck or report. For more free graph slides and premium chart templates, explore the GoodPello free graph collection.
Usage Points
-
Main Usage
Designed to visually compare two data series across seven categories in a single slide, this chart slide is ideal for market analysis, quarterly performance reports, competitor comparisons, and financial data presentations.
-
How to Use
Replace the placeholder values (30, 45, 60, etc.) and category labels (value01–07) with your actual data. Enter key insights into the two right-side text blocks, and choose between the red-gray or teal-gray color version to match your presentation theme.
-
Recommended For
Best suited for business professionals, marketers, analysts, and consultants who need to present comparative numerical data clearly and efficiently in reports, pitch decks, or strategy presentations.
-
Slide Structure
Single-slide layout featuring a grouped vertical bar chart with 7 items and 2 data series on the left, plus 2 descriptive text blocks with triangle icons on the right. Available in red-gray and teal-gray color variants.
Related Products
-

Comparative Analysis Bar Graph – Market and Competitor Analysis
#Free Graphs
-

Tree Yellow Purple Area Chart – Innovation in Data Visualization
#Free Graphs
-

Business Comparison Analysis Graph – Strengthening Market and Competitor Analysis
#Free Graphs
-

Bar Chart of Decline & Rise Analysis – Emphasizing Market Competitiveness
#Free Graphs
