Worldwide Organic Food Production Map – Global Market Analysis
RJ0600096_14
- Last Update 07/16/2025
- File Size 0.6MB
- # of Slides 2
- File Format PPTX
- Slide Ratio 16:9
- Color
Keywords
- #Content-Based Slides
- #Design-Based Slides
- #Company Introduction
- #Market and Competitor Analysis
- #Diagram
- #Other
- #Global Network
- #Market Analysis
- #Cluster
- #Chain Diagram
- #Map
- #16:9
- #world map PowerPoint slide
- #global market analysis presentation
- #geographic data visualization
- #regional comparison diagram
- #international business template
About the Product
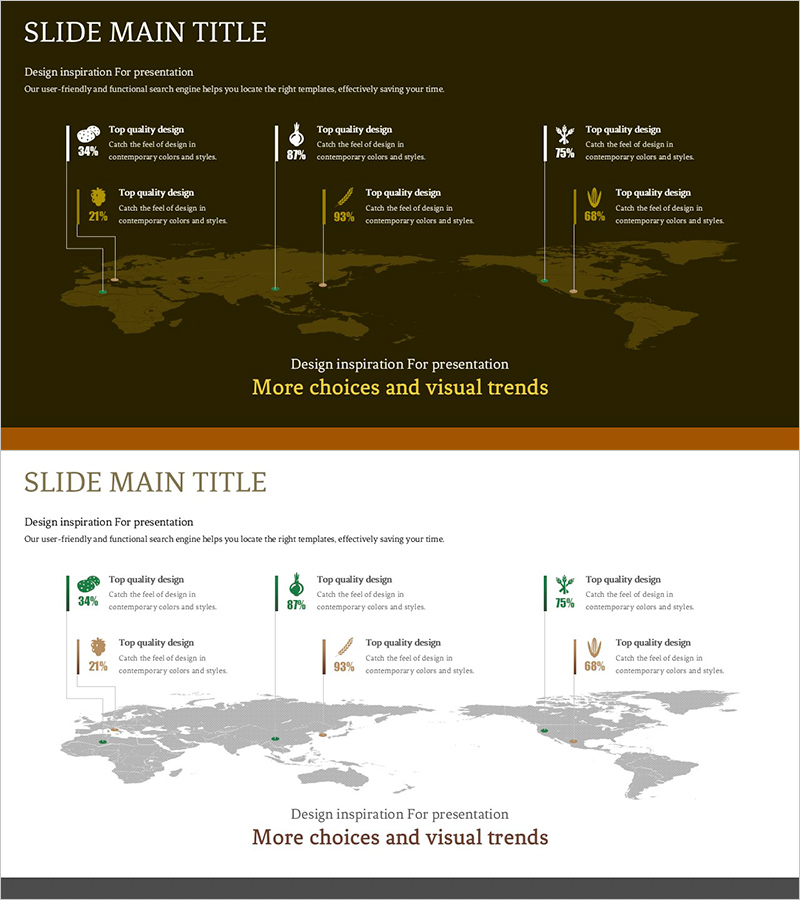
A world map-based PowerPoint slide for global market analysis. This presentation template visualizes organic food production across 6 continents using icons and numerical data. The design features a dark brown background with gold accent tones, creating a premium presentation atmosphere. The 2-slide set includes the first slide with 6 regional information boxes positioned on a world map, and the second slide with the same data reorganized on a grayscale map for comparative analysis. Ideal for international business presentations, market reports, and strategic planning decks where geographic data visualization is essential.
Usage Points
-
Main Usage
Effectively communicate international market trends, regional production comparisons, and global business strategy through geographic data visualization. The world map layout with 6 regional data points and icons enables audiences to grasp global patterns at a glance.
-
How to Use
Use the first slide with dark brown background and vertical regional information boxes for premium executive presentations. Deploy the second grayscale map slide in comparative analysis sections. All text, numbers, and data fields are fully editable in PowerPoint.
-
Recommended For
International business managers, marketing strategists, investment analysts, and executives presenting global market reports. Particularly suited for food industry, agriculture, trade, and consulting sector presentations requiring geographic market insights.
-
Slide Structure
2-slide template. Slide 1: Dark brown background with world map and 6 vertically-stacked regional information boxes containing icons, percentages, and descriptive text. Slide 2: Grayscale world map with same 6-region data repositioned for comparison. 16:9 widescreen format, fully editable PPTX with all elements customizable.
Related Products
-

Global Market Snapshot – Market Analysis and Outlook
#Company Introduction #Market and Competitor Analysis #Diagram
-

Global Comparison of National Sustainability Contributions
#Company Introduction #Market and Competitor Analysis #Graph
-

Forest Illustration Global Map – Visualizing Market Analysis
#Company Introduction #Market and Competitor Analysis #Other
-

Global Network and Market Strategy - Optimal Business Approaches
#Company Introduction #Marketing Plan and Strategy #Diagram
