Global Map Visualizing Country Distribution - Global Network Analysis
RJ0400030_19
- Last Update 05/25/2025
- File Size 8.9MB
- # of Slides 2
- File Format PPTX
- Slide Ratio 16:9
- Color
Keywords
- #Content-Based Slides
- #Design-Based Slides
- #Company Introduction
- #Market and Competitor Analysis
- #Other
- #Global Network
- #Market Analysis
- #Map
- #16:9
- #global map PowerPoint slide
- #regional distribution visualization
- #world map presentation template
- #international market analysis PPT
- #country data comparison slide
About the Product
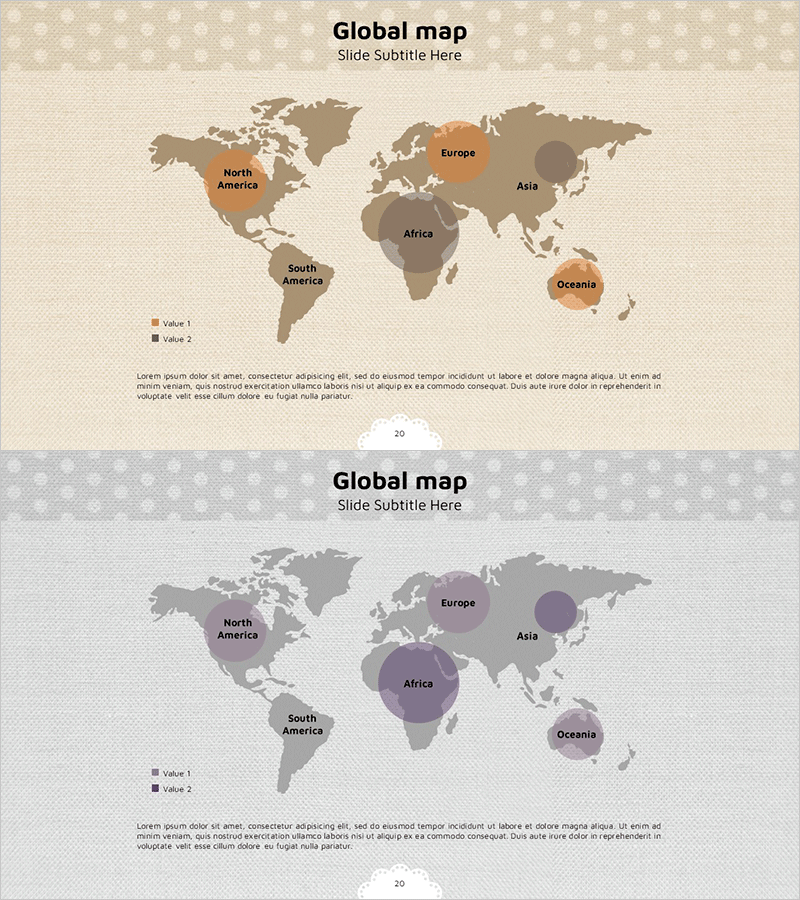
A two-slide PowerPoint presentation featuring world maps to visualize country distribution and global network analysis. The beige-toned background with brown and orange regional divisions makes it ideal for presenting global market data, regional performance, and international expansion strategies. The first slide displays six regions (North America, Europe, Asia, Africa, South America, Oceania) with color-coded distinctions and a legend. The second slide emphasizes regional comparison through bubble charts, where bubble size and color represent data magnitude. Ample text areas allow you to add market size, growth rates, and strategic importance for each region. The 16:9 widescreen format ensures compatibility with modern presentation environments and professional conference setups.
Usage Points
-
Main Usage
Communicate regional and country-level data in global business strategy, market analysis, and performance reporting. Designed for investor presentations, executive briefings, and marketing strategy sessions where comparing regional market size, growth opportunities, and competitive landscape is essential.
-
How to Use
Input numerical data (revenue, market share, growth rate) into each regional area or text box. Modify colors to represent performance tiers (excellent, average, needs improvement) or adjust bubble sizes to emphasize regional importance. Customize labels and add supporting statistics directly on the slide.
-
Recommended For
Global corporations presenting to investors or executives, marketing teams conducting market analysis, international business expansion planning, regional sales performance reviews, consulting projects, and academic presentations requiring regional data comparison.
-
Slide Structure
Slide 1: Title and subtitle area + world map with six color-coded regions + legend (Value 1, Value 2) + descriptive text box. Slide 2: Title and subtitle area + gray-background world map + regional bubble charts (size and color represent data) + text box for additional information. Two input areas total for text and numerical data customization.
Related Products
-

Global Market Snapshot – Market Analysis and Outlook
#Company Introduction #Market and Competitor Analysis #Diagram
-

Animal Distribution Map – Market and Competitive Analysis
#Company Introduction #Market and Competitor Analysis #Other
-

Global Comparison of National Sustainability Contributions
#Company Introduction #Market and Competitor Analysis #Graph
-

Global Market Analysis Map – Importance of Market Connectivity
#Company Introduction #Market and Competitor Analysis #Graph
