Global Market Snapshot – Market Analysis and Outlook
RM0800007_4
- Last Update 02/28/2025
- File Size 1.3MB
- # of Slides 2
- File Format PPTX
- Slide Ratio 16:9
- Color
Keywords
- #Content-Based Slides
- #Design-Based Slides
- #Company Introduction
- #Market and Competitor Analysis
- #Diagram
- #Other
- #Global Network
- #Market Analysis
- #Cluster
- #Chain Diagram
- #Map
- #16:9
- #world map PowerPoint slide
- #market analysis presentation
- #regional data visualization
- #global network slide
- #brand market share chart
- #map-based slide template
About the Product
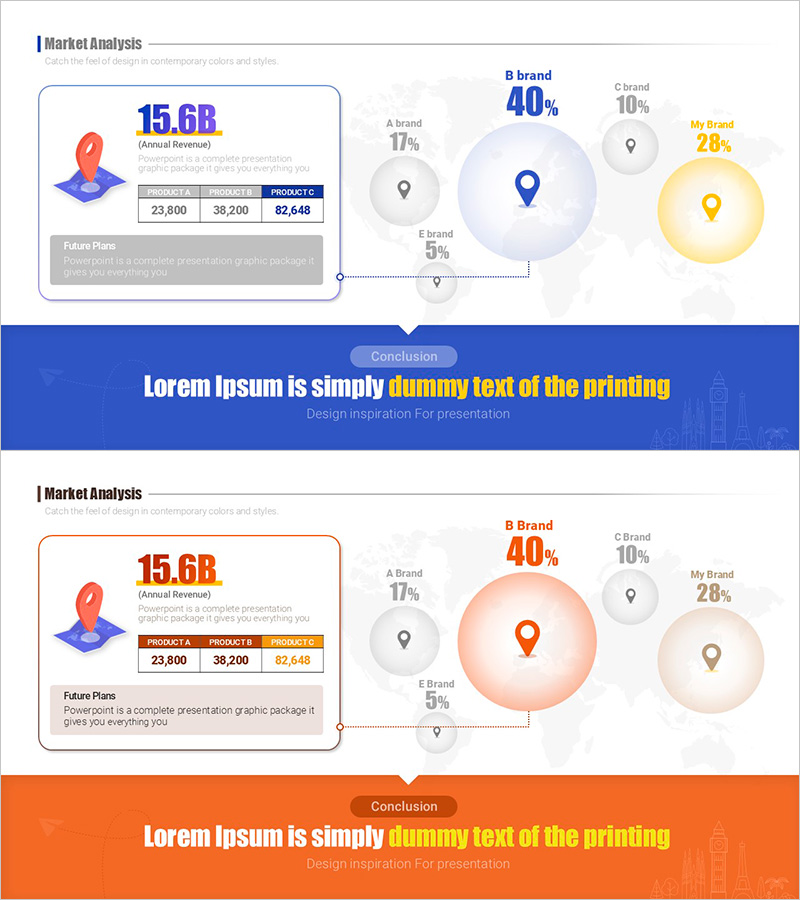
A comprehensive world map-based PowerPoint slide for visualizing global market conditions at a glance. Location pins are positioned on the map to represent regional market data, while pie charts display brand market share (Brands A–E, 5–40% distribution). The left information box organizes annual revenue (15.6B), product-specific metrics (23,800–92,648), and future plans, making it ideal for market analysis presentations, competitive landscape reviews, and global network strategy discussions. The 2-slide set features consistent design with blue and orange color variations, ensuring all elements remain clear in 16:9 widescreen format.
Usage Points
-
Main Usage
This slide communicates global market conditions and regional competitive dynamics in a single visual. By combining world map location pins with pie charts, it simultaneously presents regional brand market share, market size, and revenue figures—essential for international business strategy presentations.
-
How to Use
Edit the left information box with annual revenue, product metrics, and future plans. Adjust map pin locations and pie chart brand names and percentages to match your data. Choose between blue or orange color variations to align with your corporate branding for a cohesive presentation.
-
Recommended For
Ideal for executives and marketing professionals developing global market entry strategies, consultants preparing international business analysis reports, sales teams explaining regional performance, and startup founders pitching global business plans to investors.
-
Slide Structure
The 2-slide set features a consistent layout: left information box (revenue, product metrics, planning text), center world map (5 regional location pins), and right pie chart (5-brand market share distribution). Both blue and orange versions maintain identical layouts, allowing selection based on presentation theme and corporate color guidelines.
Related Products
-

Worldwide Organic Food Production Map – Global Market Analysis
#Company Introduction #Market and Competitor Analysis #Diagram
-

Idea Presentation Template Wide Map – Global Market Analysis
#Company Introduction #Market and Competitor Analysis #Other
-

Global Partnership Mediated by Nature – Eco-Friendly Design
#Company Introduction #Business Introduction #Diagram
-

Travel App Global Network Introduction Page – Connectivity and Collaboration
#Company Introduction #Diagram #Other
