Hobbies Horizontal Bar Subdivision Chart – Data Visualization and Analysis
RJ0600094_27
- Last Update 07/16/2025
- File Size 0.4MB
- # of Slides 2
- File Format PPTX
- Slide Ratio 16:9
- Color
Keywords
About the Product
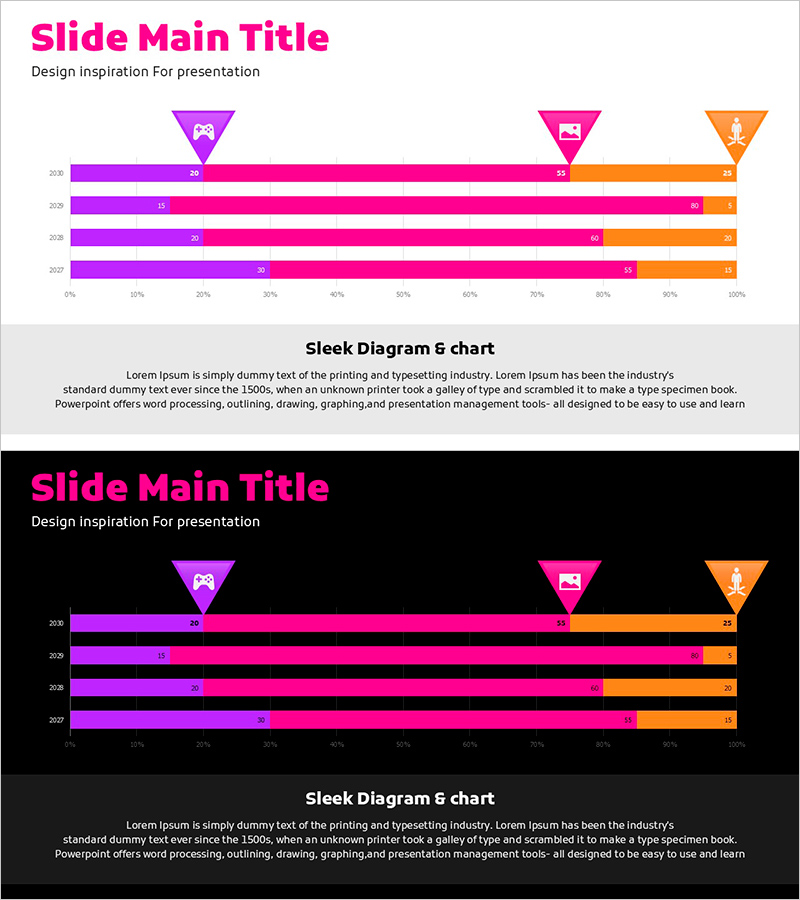
A horizontal bar chart PowerPoint slide comparing hobby activity data across four years with multi-series visualization. The slide uses three color series—purple, magenta, and orange—to represent gaming, photography, and music categories, with triangular icons positioned above each category for visual identification. Provided in two versions with light and dark backgrounds, allowing flexible integration into any presentation theme. The 2-slide set is ready to use for business reports, market analysis, and performance presentations requiring multi-category data comparison.
Usage Points
-
Main Usage
The primary goal is to present time-series and category-based data comparisons in an intuitive, scannable format. The horizontal bar layout ensures category labels remain legible, while the three-color series enables viewers to instantly recognize year-over-year trends. Ideal for marketing analysis, business reports, and statistical presentations requiring multi-dimensional data visualization.
-
How to Use
Double-click the data values on the slide to replace them with your own figures. The three color series—purple, magenta, and orange—can be reassigned to different years or categories as needed. Triangle icons are fully editable and can be swapped for alternative symbols. Choose between the light background version for standard presentations or the dark background version for modern, high-contrast displays.
-
Recommended For
Marketing professionals, data analysts, business strategists, and sales teams presenting market research findings, customer preferences, or sales trends. Particularly suited for quarterly business reviews, strategic planning presentations, regional performance comparisons, and departmental analysis reports where multi-item year-over-year comparison is essential.
-
Slide Structure
Two-slide set featuring identical chart layouts in light (white background) and dark (black background) versions. Each slide displays a horizontal bar graph with four years (2020–2023) on the Y-axis and three categories (gaming, photography, music) differentiated by color. Triangular icons are positioned above each category for enhanced visual organization and quick reference.
Related Products
-

Area Analysis Diagram
#Graph
-

Market Share Analysis Graph – Efficient Data Visualization
#Product/Service Introduction #Market and Competitor Analysis #Diagram
-

Plant Cultivation Awareness Graph – Visualizing Market Status with Horizontal Bar
#Market and Competitor Analysis #Graph #Market Status
-

Bar Graph for Competitor Analysis – Business Advantage
#Market and Competitor Analysis #Graph #Competitor Analysis
