Vertical Bar Graph Template for Business Plan
RJ0200027_20
- Last Update 04/05/2025
- File Size 2.9MB
- # of Slides 2
- File Format PPTX
- Slide Ratio 16:9
- Color
Keywords
About the Product
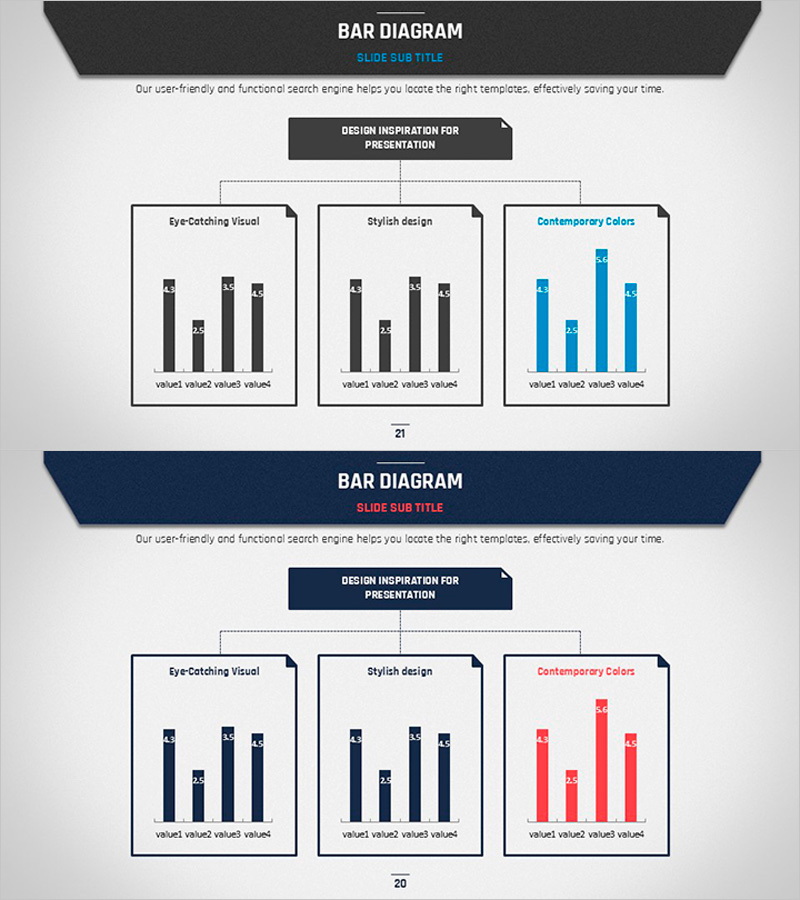
A professional vertical bar chart PowerPoint slide set featuring 2 slides designed for business plan presentations and data comparison. The template includes three color schemes—charcoal, navy blue, and red—enabling clear visualization of 4-item data comparisons. Ideal for competitive analysis, market analysis, sales performance tracking, and financial reporting. Each slide is fully editable in 16:9 widescreen PPTX format, compatible with all PowerPoint versions. Simply input your data values and the chart updates automatically.
Usage Points
-
Main Usage
Visualize and compare 4 data points—such as sales figures, market share, competitor metrics, or departmental performance—using vertical bar charts. Perfect for business plans, quarterly reports, marketing proposals, and strategic presentations where numerical comparisons drive decision-making.
-
How to Use
Double-click the chart to enter edit mode and replace sample values with your actual data. Modify bar colors to match your corporate branding, adjust axis labels and legend text as needed. The chart automatically recalculates and updates when you input new data values in the PowerPoint chart editor.
-
Recommended For
Executives, finance teams, marketing departments, and sales teams presenting quarterly performance, market analysis, competitive positioning, and strategic initiatives. Effective for investor presentations, board meetings, and data-driven business discussions requiring clear numerical comparisons.
-
Slide Structure
Slide 1: Charcoal background with 4-bar vertical chart (Eye-Catching Visual style) / Slide 2: Navy blue background with 4-bar vertical chart (Stylish Design style) / Additional variations in blue and red color schemes. Each slide functions independently with clearly marked data input areas for seamless customization.
Related Products
-

Mobile Financial Services Analysis – Market and Competitor Insights
#Market and Competitor Analysis #Graph #Competitor Analysis
-

Comparative Analysis Bar Graph & Table – Optimized for Market and Competitor Analysis
#Market and Competitor Analysis #Diagram #Graph
-

Pie & Bar Analysis Graphs – Optimized for Market and Competitor Analysis
#Market and Competitor Analysis #Graph #Competitor Analysis
-

Comparative Analysis Split Bar Graph – Reliable Market Analysis
#Market and Competitor Analysis #Graph #Competitor Analysis
