Blackboard Chalk Theme Market Analysis Graph – Creative Data Visualization
RJ0400025_6
- Last Update 05/24/2025
- File Size 5.7MB
- # of Slides 2
- File Format PPTX
- Slide Ratio 16:9
- Color
Keywords
About the Product
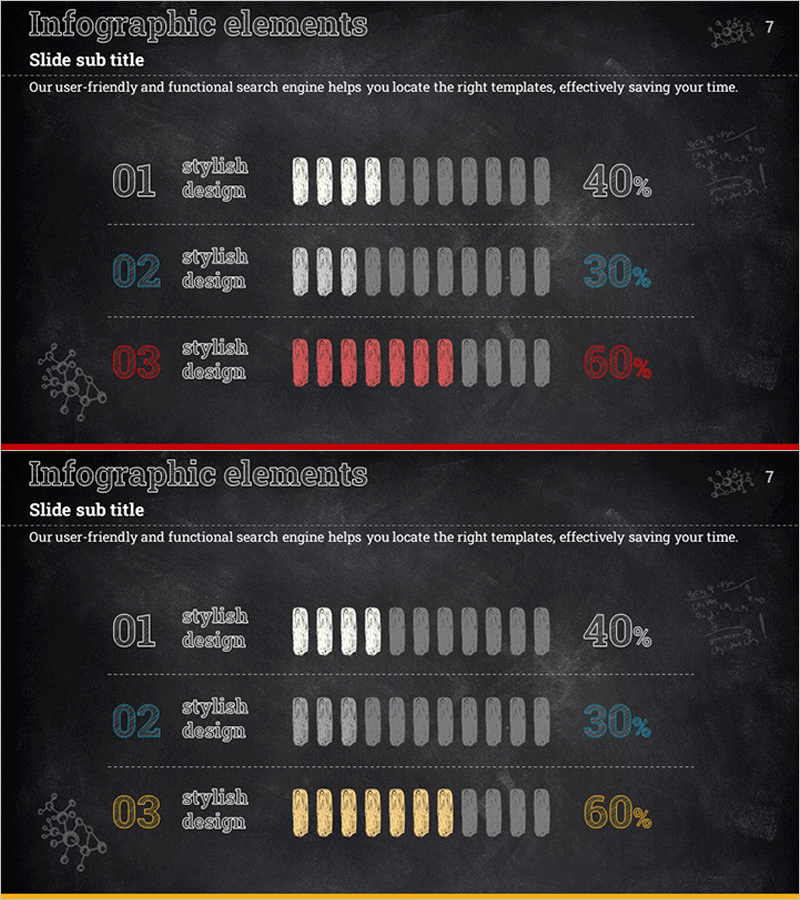
A 2-slide PowerPoint presentation designed for market analysis and competitive benchmarking. The blackboard background with chalk-style graphics creates a distinctive visual identity, featuring three-step comparison bar charts that display market share, growth rates, and competitor positioning. White, blue, red, and yellow accent colors provide strong contrast against the dark background, enhancing audience engagement during presentations. The layout clearly separates title and subtitle areas from data visualization zones, making it easy to customize with your own figures. Ideal for business plans, marketing strategies, quarterly reports, and investor pitches.
Usage Points
-
Main Usage
Visualize quantitative market data—such as market share, growth rates, and competitor analysis—using multi-step bar charts. The creative blackboard chalk aesthetic transforms dry data presentations into engaging visual narratives, making it ideal for executive briefings, investor pitches, and strategic planning sessions.
-
How to Use
Insert into the market analysis section of business plans, marketing strategies, or quarterly reports. Replace placeholder text with your actual market data, update titles and legends to match your presentation context, and adjust color emphasis to highlight key findings or competitive advantages.
-
Recommended For
Marketing teams, strategy departments, executives, and investors presenting market entry strategies, competitive benchmarking, quarterly performance reviews, or new business opportunities. Works well for both internal strategy meetings and external stakeholder presentations.
-
Slide Structure
Two-slide layout with distinct visual emphasis. Each slide includes a title area, subtitle area, three-step comparison bar chart, and legend section. Slide 1 emphasizes white and blue; Slide 2 emphasizes red and yellow, allowing simultaneous comparison of multiple market indicators.
Related Products
-

Battery Shape Vertical Bar Graph – Competitor Analysis
#Technical Approach #Market and Competitor Analysis #Graph
-

Backpacking Traveler Trends Analysis Graph – Future of Travel Industry
#Technical Approach #Market and Competitor Analysis #Graph
-

Weather Forecast Accuracy Probability Graph – A Tool for Market Analysis
#Business Introduction #Market and Competitor Analysis #Graph
-

Consumer Trend Changes and Market Outlook – Market Trends Analysis
#Market and Competitor Analysis #Graph #Other
