Map-Based Data Presentation Slide – Global Market Analysis
RJ0600093_27
- Last Update 07/16/2025
- File Size 0.8MB
- # of Slides 2
- File Format PPTX
- Slide Ratio 16:9
- Color
Keywords
About the Product
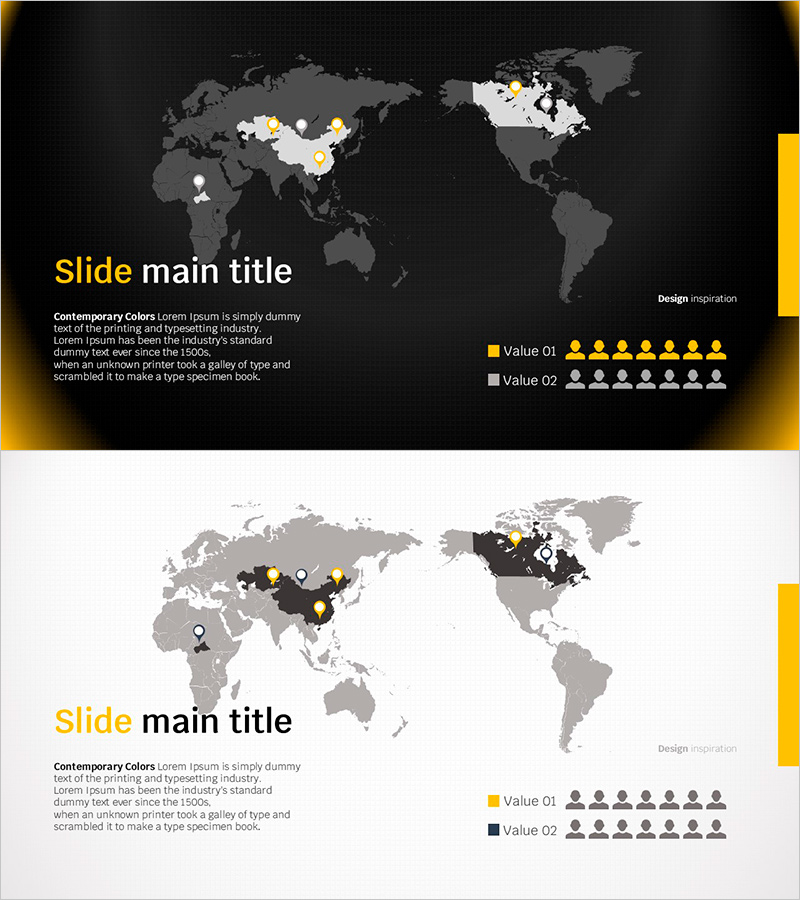
A 2-slide map-based PowerPoint presentation template for visualizing global market distribution and regional data. Features a dark gray background with gold accent markers and white typography that conveys professional authority. The world map displays yellow circular markers and icons to highlight key market locations, while a legend compares two data layers (Value 01 and Value 02) using icon-based visualization. The left text area accommodates market analysis descriptions, and the right legend uses people icons to represent scale metrics. Delivered in 16:9 widescreen PPTX format, fully editable and ready for immediate use in investor presentations.
Usage Points
-
Main Usage
Visualize international market presence, regional business distribution, and global network expansion on an interactive world map. Compare two data dimensions simultaneously (Value 01 vs Value 02) to highlight market insights and competitive positioning for stakeholder presentations.
-
How to Use
Click yellow circular markers on the world map to add or modify key market locations. Enter market analysis text in the left text box and adjust people icons in the right legend to represent scale data. The dark background is optimized for projector presentations and maintains visibility in various lighting conditions.
-
Recommended For
Ideal for company overview presentations, business plans, and investor pitch decks when explaining global expansion strategy and international network presence. Effective in market analysis reports showing regional market share, customer distribution, and partner locations across continents.
-
Slide Structure
Two-slide set: dark background version with gold accents and light background version with black accents. Each slide divides into three zones: world map area (70% left), text input section (30% lower left), and legend area (20% right). All markers, icons, and text fields are fully customizable.
Related Products
-

Premium Management Presentation Map Analysis3 - Customer Insights and Market Analysis
#Market and Competitor Analysis #Graph #Other
-

Market Analysis Slide for Global Target Market
#Market and Competitor Analysis #Other #Customer Analysis
-

User Usage Status by Target Country – Market Analysis and Insights
#Market and Competitor Analysis #Diagram #Other
-

User Analysis Status by Country – Insights and Vision
#Market and Competitor Analysis #Other #Customer Analysis
