Diagram of User Gender Ratio by Country - Market and Customer Insights
RJ0300045_30
- Last Update 04/30/2025
- File Size 0.9MB
- # of Slides 2
- File Format PPTX
- Slide Ratio 16:9
- Color
Keywords
About the Product
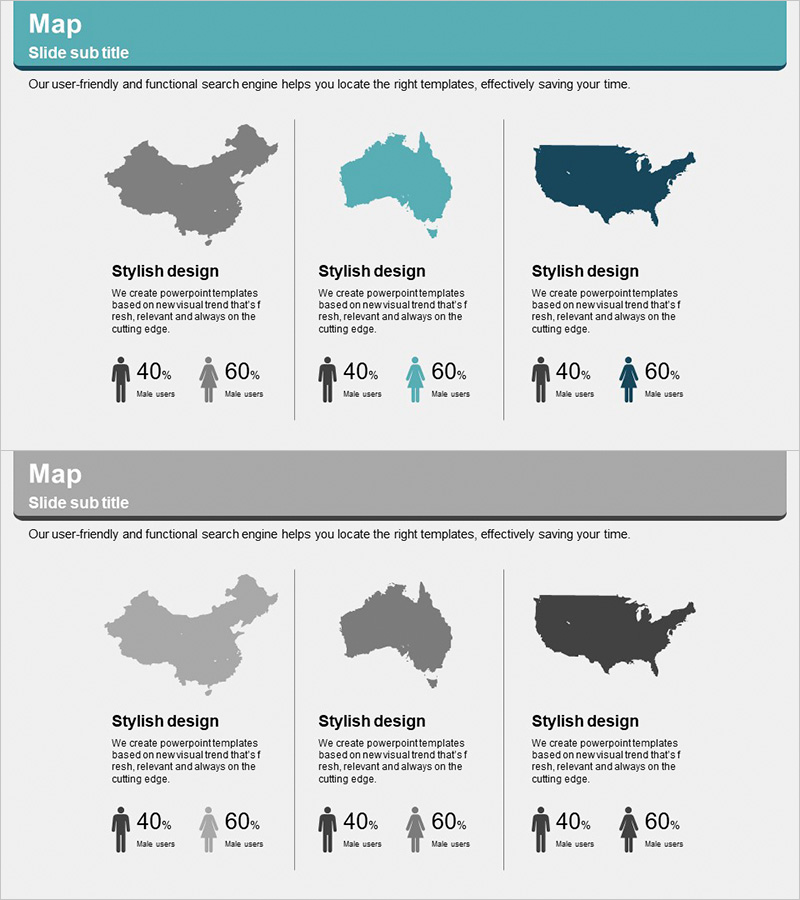
A PowerPoint slide that visualizes user gender ratios across countries using maps and statistical icons. This presentation template displays the male-to-female user distribution (40%-60%) for China, Australia, and the United States through color-coded maps and infographics, enabling effective communication of market and customer insights. The 2-slide set features clear header sections (turquoise and gray) with distinct map color schemes (gray, turquoise, navy) for easy comparison. Ideal for presentations, reports, and marketing plans that require regional customer demographic analysis.
Usage Points
-
Main Usage
Enables comparative analysis of user demographics (gender, age, profession) across countries and regions on a global market scale, presenting market segmentation data to investors, partners, and executives in an intuitive, map-based visual format.
-
How to Use
Enter country and region names in the map areas, then input actual gender ratio and percentage data in the statistics icon section below. Customize colors to represent additional countries, or duplicate slides to compare multiple metrics such as gender, age, profession, or purchasing power.
-
Recommended For
Recommended for marketing plans, market analysis reports, investment pitch decks, and business proposals that explain global customer segmentation. Particularly effective for regional target market analysis, customer persona comparison, and market entry strategy presentations.
-
Slide Structure
Slide 1: Turquoise header + 3 map regions (gray, turquoise, navy) + gender ratio icons below each map (40%-60%). Slide 2: Gray header + identical structure. Six text input areas (3 maps + 3 statistics zones) with comparative layout enabling simultaneous analysis of three-country data.
Related Products
-

User Analysis Status by Country – Insights and Vision
#Market and Competitor Analysis #Other #Customer Analysis
-

Market Analysis Slide for Global Target Market
#Market and Competitor Analysis #Other #Customer Analysis
-

Data Visualization Slide Template Featuring World Map
#Market and Competitor Analysis #Graph #Other
-

Global User Status Analysis Graph – Data Visualization
#Market and Competitor Analysis #Graph #Other
