Data Visualization Slide Template Featuring World Map
RJ0700024_25
- Last Update 07/28/2025
- File Size 3.2MB
- # of Slides 2
- File Format PPTX
- Slide Ratio 16:9
- Color
Keywords
- #Content-Based Slides
- #Design-Based Slides
- #Market and Competitor Analysis
- #Graph
- #Other
- #Customer Analysis
- #Target Market
- #Other
- #Other Charts
- #Map
- #16:9
- #world map PowerPoint slide
- #data visualization presentation
- #regional percentage chart
- #global map infographic
- #world map data representation
- #geographic data slide template
- #how to create world map in PowerPoint
About the Product
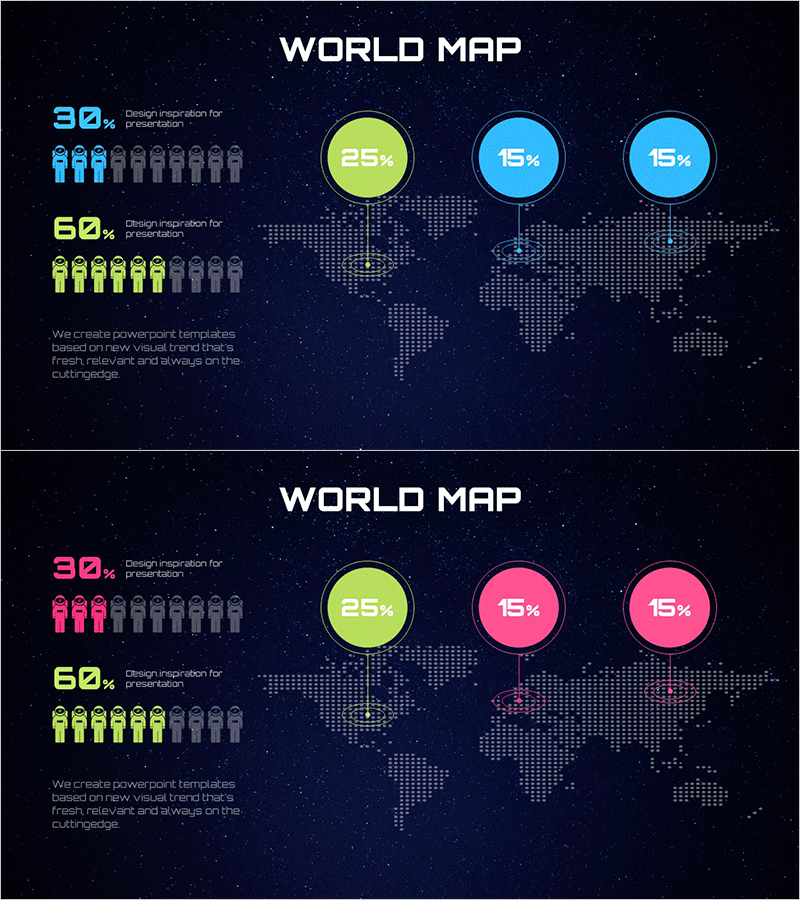
A dark navy space-themed world map PowerPoint slide featuring pixel-style geography visualization. Three global regions are highlighted with circular percentage charts and population icons positioned above the dotted world map. The left side displays regional percentage data with human silhouette icons, while the upper right provides descriptive text areas. This 16:9 widescreen 2-slide template is ready for international market analysis, global strategy presentations, and regional performance reports. Easily customize percentages, chart colors, and region labels to match your business data.
Usage Points
-
Main Usage
Visualize international market analysis, compare regional performance metrics, display global market share distribution, represent country-level statistical data, and present multinational expansion strategies. The combination of world map, circular charts, and population icons enables complex data to be understood at a glance during executive presentations.
-
How to Use
Open the slide and modify the left-side percentage values and population icons with your actual data. Update the circular chart colors and percentages on the right side, then enter region names or descriptions in the text area. Adjust highlighted regions on the world map as needed and export for immediate presentation use.
-
Recommended For
International marketing managers, global business strategists, market research analysts, multinational corporation executives, international development professionals, and overseas sales teams presenting regional performance, market share distribution, and global expansion initiatives.
-
Slide Structure
2-slide set with identical layout. Each slide features: left section with percentage values (30%, 60%, etc.) and 10 human silhouette icons; center pixel-style world map; right section with 3 circular percentage charts (25%, 15%, 15%) and connecting lines; title area at top. Dark navy background with lime green, cyan blue, and hot pink accent colors throughout.
Related Products
-

Premium Management Presentation Map Analysis3 - Customer Insights and Market Analysis
#Market and Competitor Analysis #Graph #Other
-

Global User Status Analysis Graph – Data Visualization
#Market and Competitor Analysis #Graph #Other
-

Global Customer Market Analysis Slide – Market and Competitor Analysis
#Market and Competitor Analysis #Graph #Other
-

Analysis of Ship Fire Accident – Capturing Stability and Trust
#Market and Competitor Analysis #Risk Management and Regulatory Compliance #Graph
