Minimal Graph Design for Data Comparison – Enjoying a Day
RJ0600093_25
- Last Update 07/16/2025
- File Size 2.2MB
- # of Slides 2
- File Format PPTX
- Slide Ratio 16:9
- Color
Keywords
About the Product
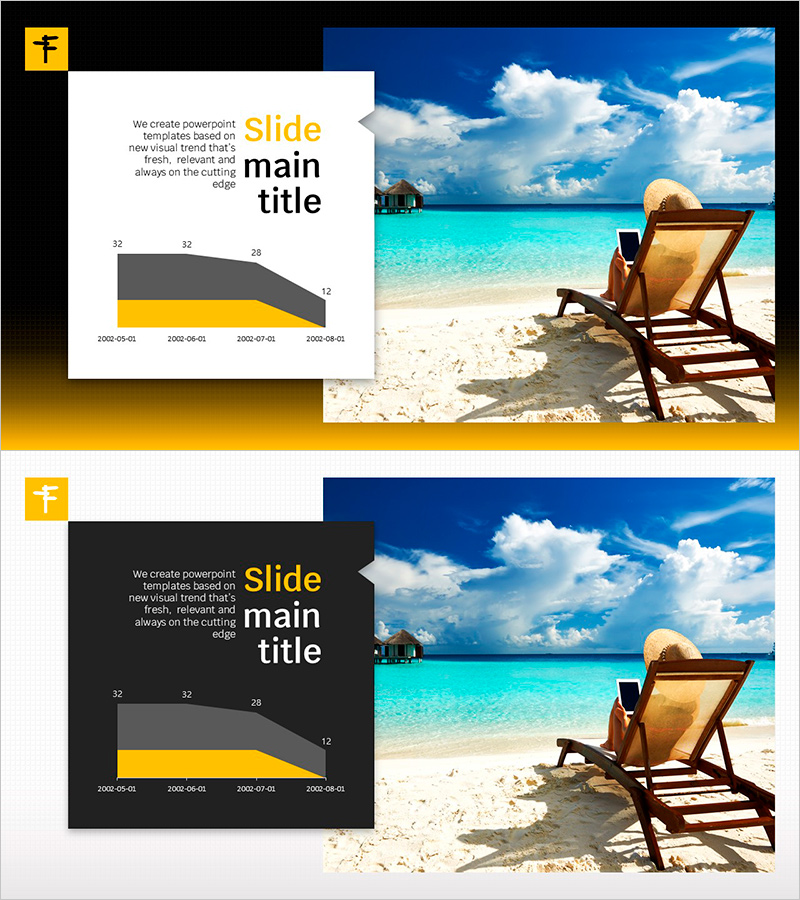
A minimal area chart PowerPoint slide featuring a serene beach vacation background. This 2-slide set provides both white and dark background versions for flexible presentation environments. The design displays four data series across time periods from 2002 to 2008, with gray area fills and yellow accent colors creating clear visual contrast. The area chart format enables intuitive comparison of cumulative trends, making it ideal for quarterly performance analysis, market share evolution, customer satisfaction trends, and multi-category sales comparisons in business presentations.
Usage Points
-
Main Usage
Visualize cumulative multi-series data trends across time periods using an area chart format. Ideal for quarterly revenue analysis, customer segment growth comparison, market share evolution, product category sales tracking, and stacked data representation in executive presentations.
-
How to Use
Double-click the area chart to edit data values with your own figures. Use the white background version for bright presentation venues and the dark version for dimly lit environments. Customize the yellow accent color to match your corporate brand identity while maintaining the overall design structure.
-
Recommended For
Executive reports, quarterly performance presentations, marketing analytics, financial status updates, and market analysis materials. Recommended for consulting firms, financial institutions, manufacturing companies, and retail businesses presenting data-driven insights.
-
Slide Structure
2-slide set featuring identical area chart layouts in white background (top) and dark background (bottom) versions. Each slide contains a 4-series stacked area chart with color-coded data regions, legend, time-axis labels (2002–2008), and title area for customization.
Related Products
-

3D Segmented Bar Graph for Performance Analysis – Market Trends
#Market and Competitor Analysis #Graph #Customer Analysis
-

Blue Green Bundled Chart – Visualizing Market Trends
#Market and Competitor Analysis #Graph #Industry Trends
-

3D Area Graph – Market Analysis and Competitive Advantage
#Market and Competitor Analysis #Graph #Market Analysis
-

Modern Blue Presentation Area Chart - Optimized for Market Analysis
#Market and Competitor Analysis #Graph #Other
