3D Area Graph – Market Analysis and Competitive Advantage
RJ0300067_27
- Last Update 05/07/2025
- File Size 3MB
- # of Slides 2
- File Format PPTX
- Slide Ratio 16:9
- Color
Keywords
About the Product
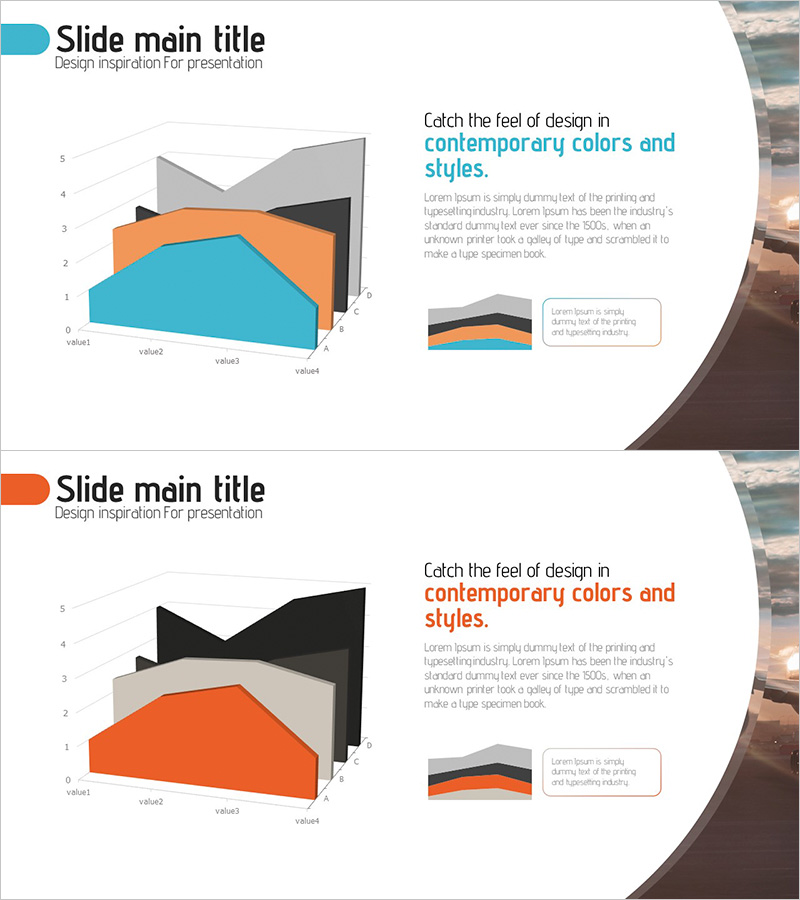
Visualize market analysis and competitive advantage with a 3D area chart in this PowerPoint slide template. Four data series in teal, orange, black, and gray stack to show market trends and share distribution intuitively. The 2-slide 16:9 widescreen deck is ready for business presentations, marketing pitches, and executive reports. The 3D effect amplifies visual impact for data comparison, and each series color is fully editable to match your analysis results.
Usage Points
-
Main Usage
Ideal for displaying market size, share, and data trends over time using cumulative area representation. The 3D effect enables simultaneous comparison of multiple data series while clearly showing individual trend lines. Provides strong visual evidence for executive briefings, investor pitches, and market analysis presentations.
-
How to Use
Place the 3D area chart on the left side of the slide and add key messages and explanatory text on the right. Edit each series color and data values to match your analysis, then update the legend and axis labels. Use both slides sequentially in your presentation flow or select individual slides as needed for your narrative.
-
Recommended For
Perfect for marketing, sales, finance, and executive teams presenting market conditions, competitive analysis, and revenue trends. Suitable for business plans, investor pitches, quarterly reports, market research presentations, and product positioning decks. Works as a trusted visualization tool for any data-driven business presentation requiring credible analysis support.
-
Slide Structure
Two-slide layout with the first slide featuring a 4-series 3D area chart in teal, orange, black, and gray, paired with title and description text on the right. The second slide presents the same graph structure with adjusted color arrangement for alternative data scenarios. Optimized for 16:9 widescreen format in modern presentation environments.
Related Products
-

Abstract Pattern Area Chart Template – Distinctive Data Visualization
#Market and Competitor Analysis #Graph #Other
-

Comparative Analysis of Eco-Friendly Categories Slide – Market Competitive Advantage
#Market and Competitor Analysis #Financial Plans and Performance #Diagram
-

Bundled Charts by Category – Market and Competitor Analysis
#Market and Competitor Analysis #Graph #Market Analysis
-

Market Competitive Advantage Analysis with Donut Graph
#Market and Competitor Analysis #Diagram #Graph
