Minimal Design Visual Data Visualization Slide
RJ0600093_24
- Last Update 07/16/2025
- File Size 2.9MB
- # of Slides 2
- File Format PPTX
- Slide Ratio 16:9
- Color
Keywords
- #Content-Based Slides
- #Design-Based Slides
- #Market and Competitor Analysis
- #Graph
- #Market Analysis
- #Horizontal Bar
- #Segmented Horizontal Bar
- #16:9
- #horizontal bar chart PowerPoint
- #data visualization slide template
- #comparison chart PPT
- #numerical data presentation
- #how to create bar chart in PowerPoint
About the Product
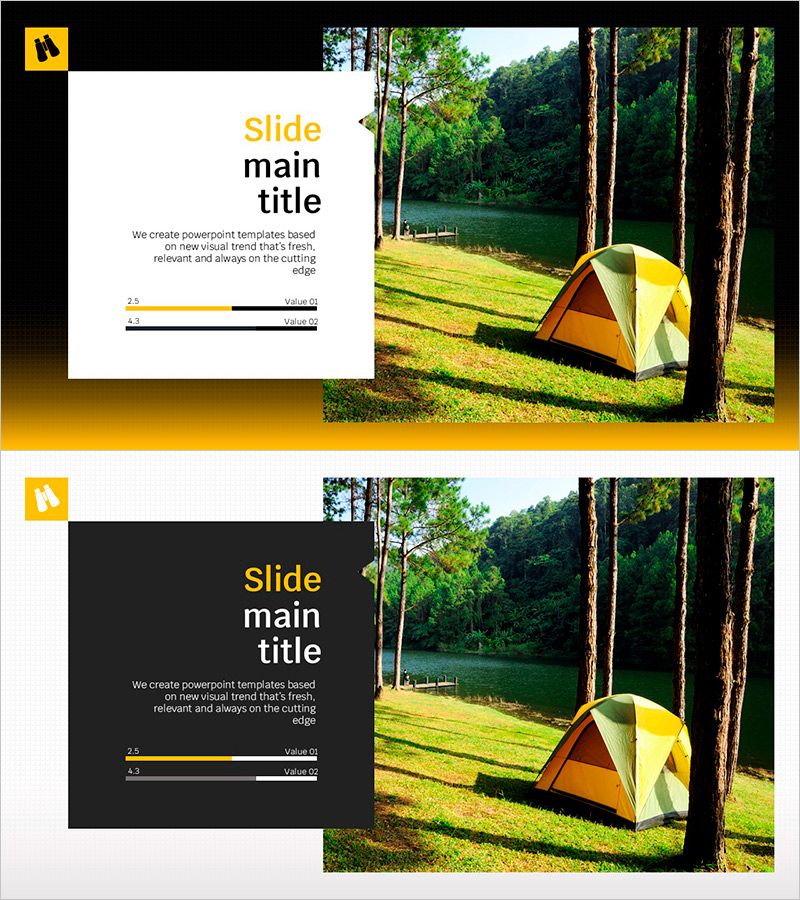
A data visualization PowerPoint slide featuring a natural landscape background with yellow and black color accents. This presentation template uses horizontal bar charts across 2 series to compare numerical values and performance metrics with clarity and impact. The minimalist layout with white space ensures effective information delivery, making it ideal for business reports, pitch decks, and performance presentations. Provided in 16:9 widescreen format with 2 editable slides in PPTX.
Usage Points
-
Main Usage
Visualize and compare two data series using horizontal bar charts, making it easy to display side-by-side metrics such as revenue comparison, performance benchmarks, budget vs. actual, or year-over-year trends. The layout emphasizes numerical differences for quick stakeholder understanding.
-
How to Use
Insert this slide into performance reports, quarterly business reviews, market analysis presentations, or financial forecasts. Edit the bar lengths and data labels to reflect your actual figures, and customize colors or background imagery to align with your corporate branding or presentation theme.
-
Recommended For
Finance professionals, marketing teams, and executives preparing data-driven reports and strategic presentations. Ideal for departmental budget reviews, competitive benchmarking, sales performance analysis, and any scenario requiring quantitative comparison between two metrics or time periods.
-
Slide Structure
2-slide set with horizontal bar charts on each slide. Each chart displays 2 data series differentiated by yellow and black bars, complete with numerical labels, legend, and title area. Asymmetrical layout combines right-side landscape imagery with left-side white text space for balanced visual composition.
Related Products
-

Wave Theme Segmented Bar Graph – Competitive Market Analysis
#Market and Competitor Analysis #Graph #Competitor Analysis
-

Segmented Graph of Learning Goal Achievement – Market and Competitor Analysis
#Market and Competitor Analysis #Graph #Competitor Analysis
-

Regional Analysis Graphs – Visualizing Market Trends
#Market and Competitor Analysis #Graph #Other
-

Business Partner Analysis Bar Graph – Market Insights
#Market and Competitor Analysis #Graph #Competitor Analysis
