Progress Donut Chart – Visual Aid for Market Analysis
RJ0600092_8
- Last Update 07/15/2025
- File Size 0.2MB
- # of Slides 2
- File Format PPTX
- Slide Ratio 16:9
- Color
Keywords
- #Content-Based Slides
- #Design-Based Slides
- #Market and Competitor Analysis
- #Graph
- #Other
- #Market Analysis
- #Market Overview
- #Circles
- #Doughnut Chart
- #Map
- #16:9
- #world map PowerPoint slide
- #global market analysis presentation
- #regional marketing template
- #international business slides
- #map pin marker template
- #market analysis diagram PowerPoint
About the Product
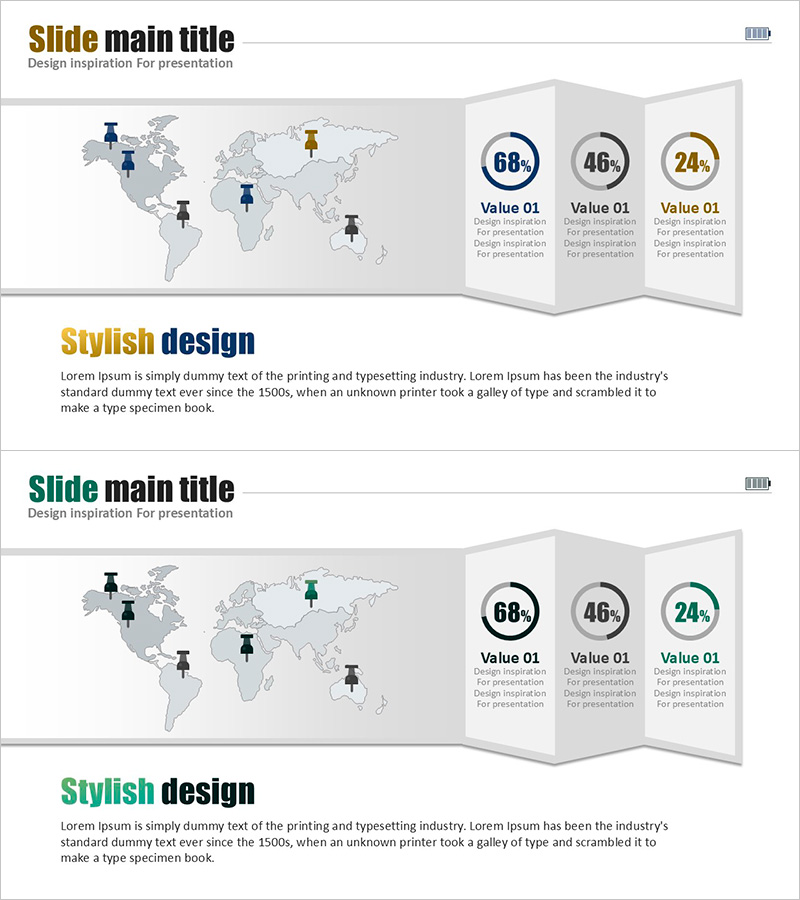
A professional world map-based PowerPoint slide set designed for global business strategy presentations. The template features a light gray world map with colorful pin markers (blue, brown, black, yellow, gray) positioned to represent regional markets, competitor locations, and business expansion zones. On the right side, three circular percentage charts (68%, 46%, 24%) are arranged in a 3D folding box layout to highlight key metrics such as regional market share, growth rates, and target achievement. The 16:9 widescreen format with 2-slide composition is ready for immediate use in international marketing presentations, market analysis reports, and executive briefings. Built with standard PowerPoint shapes and charts, all colors, text, and numerical values are fully editable to match your specific data and branding.
Usage Points
-
Main Usage
Ideal for visualizing global market expansion strategies, regional competitive landscapes, and international sales networks. The pin markers on the world map clearly indicate business locations, regional offices, and partner positions, while the circular charts simultaneously communicate key metrics such as market share, growth rates, and performance targets for each region.
-
How to Use
Use this template in international marketing presentations, executive briefings, investor pitches, and market analysis reports. Customize the pin marker positions and colors to represent different regions, business units, or product lines. Update the circular chart percentages with your actual data and add text labels to identify regional managers, office names, or target values. The layout accommodates both quantitative and qualitative information seamlessly.
-
Recommended For
International sales and marketing managers, business strategy teams, overseas business development professionals, management consulting analysts, and investor relations (IR) specialists who need to communicate global market conditions persuasively. Particularly effective for presentations on multi-country expansion plans, regional performance comparisons, and international partnership initiatives.
-
Slide Structure
Slide 1: Light gray world map with 5 pin markers (blue, brown, black, yellow, gray) + title and subtitle. Slide 2: Same map background with 3 circular percentage charts (68%, 46%, 24% in blue, gray, and yellow accents) arranged in 3D folding box format + 'Value 01' labels. Total 2 slides, 16:9 aspect ratio, PPTX format.
Related Products
-

Industry Trend Analysis Donut Chart – Visual Trends Presentation
#Market and Competitor Analysis #Diagram #Graph
-

Idea Presentation Template Wide – Market Analysis and Visualization
#Market and Competitor Analysis #Graph #Other
-

Detailed Analysis in Book Illustration PowerPoint Template
#Market and Competitor Analysis #Diagram #Graph
-

Donut Chart & Map Template for Social Network Visualization
#Market and Competitor Analysis #Graph #Other
