Camera History Timeline Slide – Capturing the Flow of Time
RJ0600092_7
- Last Update 07/15/2025
- File Size 0.1MB
- # of Slides 2
- File Format PPTX
- Slide Ratio 16:9
- Color
Keywords
About the Product
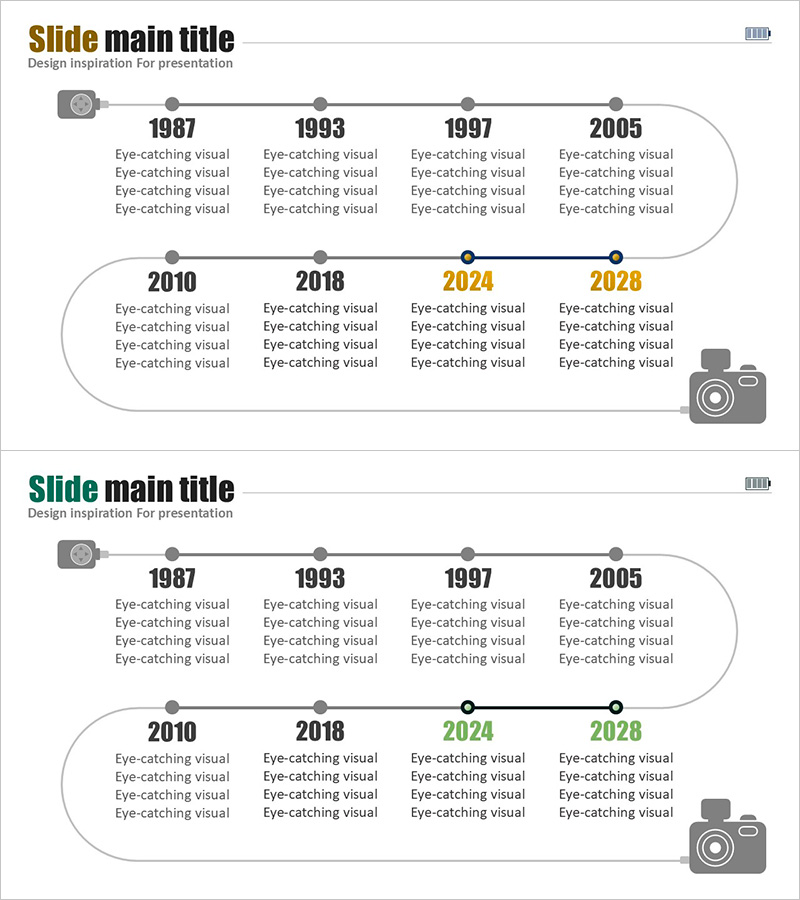
An 8-point timeline diagram PowerPoint slide presenting the evolution of camera technology from 1987 to 2028. This presentation slide uses a linear flow structure with camera icons and connecting lines to represent chronological progression. Each milestone is marked with bold year labels and descriptive text blocks, connected by a continuous horizontal line. The design employs a neutral gray and black color palette with camera silhouettes at both ends to frame the historical narrative. The 2-slide deck in 16:9 widescreen format features fully editable shapes, allowing you to customize text, colors, icons, and layout to match your brand guidelines or presentation theme.
Usage Points
-
Main Usage
This timeline diagram is designed to communicate historical progression, milestones, and evolutionary changes in a clear, visually organized manner. It effectively presents company history, product development stages, technological breakthroughs, or market transformation over time. The linear structure helps audiences follow a chronological narrative and understand key turning points in your organization's journey.
-
How to Use
Insert this slide into company overview presentations (Company History section), product launch decks (Technology Evolution section), or business strategy documents (Market Transformation section). Double-click any text box to edit years and descriptions. Replace camera icons with your company logo or relevant symbols. Adjust colors by selecting shapes and using the Format menu to align with your corporate identity.
-
Recommended For
Ideal for executives, marketing teams, product managers, and sales professionals presenting company milestones, product roadmaps, or technological advancement. Particularly effective for investor pitch decks (Series A/B funding), annual reports, corporate anniversary presentations, and competitive positioning slides. Works well when highlighting innovation trajectory or market leadership evolution.
-
Slide Structure
Eight nodes arranged horizontally from left to right, starting with a camera icon and ending with another camera icon. Each node contains a year label (1987, 1993, 1997, 2005, 2010, 2018, 2024, 2028) with four lines of descriptive text below. Nodes are distributed across two rows (top and bottom) to maximize slide real estate. A continuous horizontal line with circular connection points links all nodes, creating a unified visual flow.
Related Products
-

Fountain Pen History Diagram – Emphasizing Corporate Identity
#Company Introduction #Product/Service Introduction #Diagram
-

Introduction to the History of the Architectural Company – A Visual Timeline
#Company Introduction #Diagram #Company Overview
-

History Overlay Diagram – Company Introduction Slide
#Company Introduction #Diagram #History
-

Business History Connection Diagram – Company Growth Story
#Company Introduction #Diagram #History
