Area Chart for Science Topics – Gain Competitive Advantage through Data Analysis
RJ0500004_8
- Last Update 06/08/2025
- File Size 1.8MB
- # of Slides 2
- File Format PPTX
- Slide Ratio 16:9
- Color
Keywords
- #Content-Based Slides
- #Design-Based Slides
- #Market and Competitor Analysis
- #Graph
- #Other
- #Market Status
- #Competitive Advantage
- #16:9
- #area chart PowerPoint slide
- #stacked area graph presentation
- #two-layer data comparison chart
- #market analysis PowerPoint template
- #how to create area chart in PowerPoint
About the Product
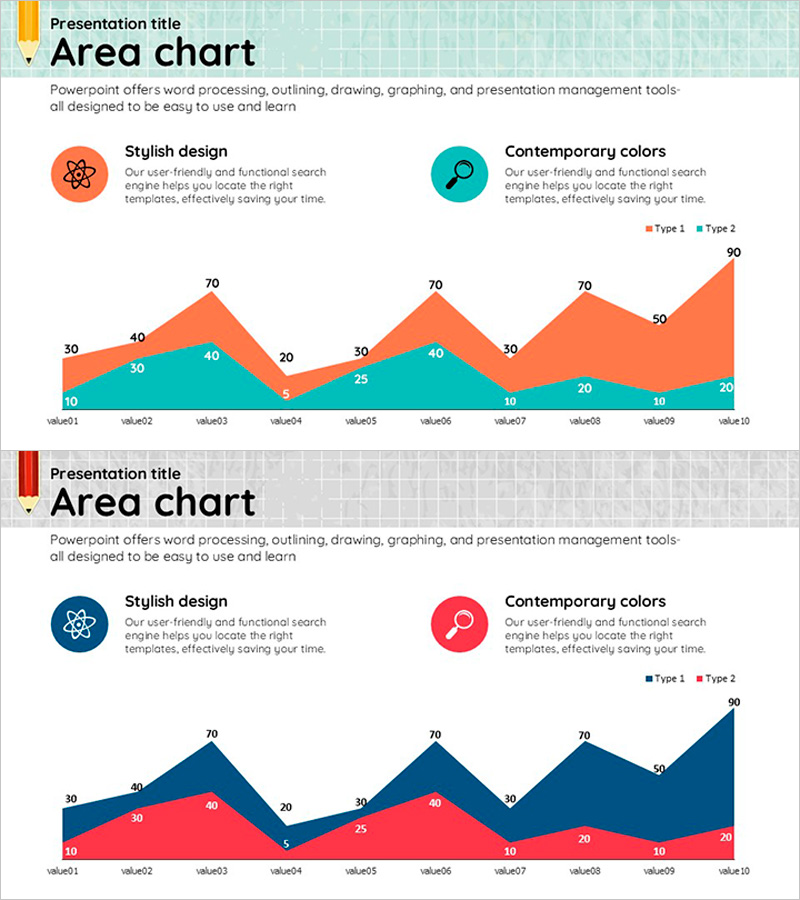
A two-layer area chart PowerPoint slide designed for data analysis and market visualization. The stacked area graph in orange and blue displays the trends and comparison of two data series over time across 10 data points in a horizontal layout. Ideal for competitive advantage analysis, market share comparison, and scientific research result visualization. Fully editable in PPTX format with customizable colors and numerical values for immediate use in presentations.
Usage Points
-
Main Usage
Visualizes and compares two data series trends over time simultaneously. Effectively communicates quantitative data for competitive analysis, market share changes, scientific experiment comparisons, and performance metrics in executive presentations.
-
How to Use
Insert this slide into market analysis, competitor comparison, or financial performance sections of your presentation. Edit the title area at the top, update the icon labels and text boxes for each data series, and replace chart values with your actual data.
-
Recommended For
Recommended for business analysts, researchers, marketing strategists, and executives preparing investor presentations, market reports, scientific research findings, and business performance analyses. Essential for decision-support materials requiring quantitative evidence.
-
Slide Structure
Two-slide set with identical layout: title area with two icons and text boxes at top, central stacked area chart with 10 data points and two layers, and legend section. First slide uses orange-blue combination; second uses blue-red combination for diverse data comparison scenarios.
Related Products
-

World Travel Template Area Chart
#Market and Competitor Analysis #Graph #Other
-

2 Versions of the Green Area Chart – Market Analysis and Competitive Edge
#Market and Competitor Analysis #Graph #Other
-

Bar Chart Visualizing Yacht Tour Satisfaction
#Market and Competitor Analysis #Graph #Other
-

Market Analysis Using Pencil Bar Graph
#Market and Competitor Analysis #Graph #Other
