Forest Construction Graphs and Strategies – Sustainable Competitive Advantage
RJ0600091_23
- Last Update 07/15/2025
- File Size 0.1MB
- # of Slides 2
- File Format PPTX
- Slide Ratio 16:9
- Color
Keywords
- #Content-Based Slides
- #Design-Based Slides
- #Market and Competitor Analysis
- #Graph
- #Market Analysis
- #Competitive Advantage
- #Line
- #Line Chart
- #16:9
- #line chart PowerPoint slide
- #dual series trend analysis
- #multi-line graph template
- #market analysis presentation
- #competitive advantage chart
- #data comparison slide template
About the Product
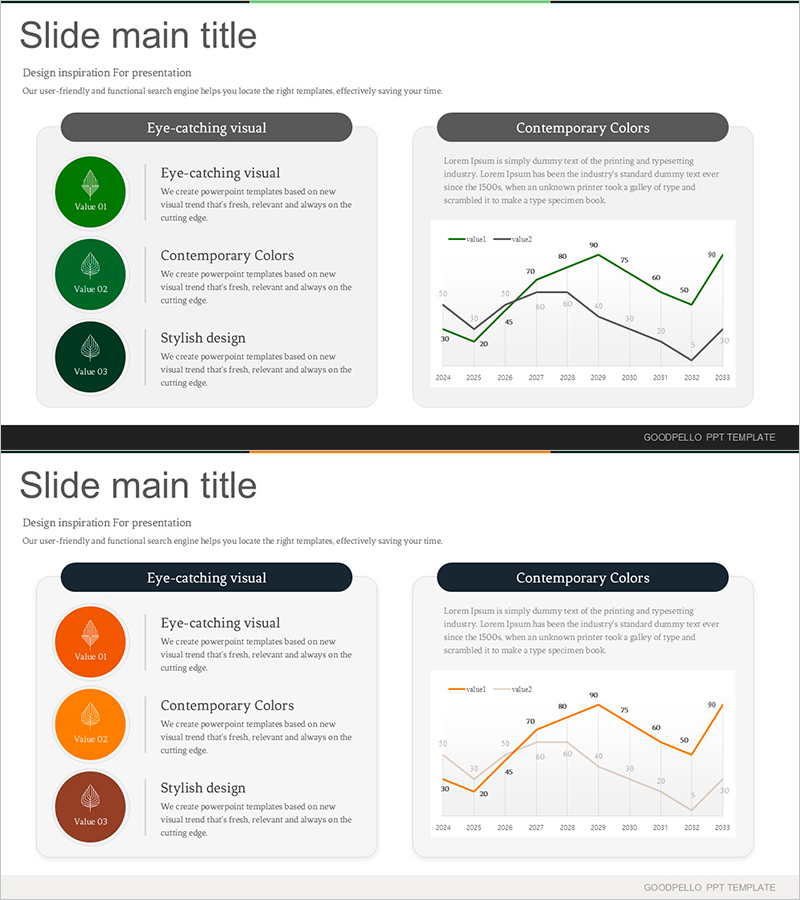
A professional multi-series line chart PowerPoint slide designed for market analysis and competitive advantage strategy presentations. This slide template features two distinct data series visualized through a dual-line graph, enabling clear trend comparison from 2024 to 2033. The left section displays three circular icon callouts for key strategic points, while the right section presents the line chart with color-coded series (green and orange) for easy differentiation. The 16:9 widescreen format and PPTX structure allow seamless integration into business presentations, reports, and strategic planning documents.
Usage Points
-
Main Usage
Visualize and compare two or more data series over time to identify trends, patterns, and performance gaps. Suitable for displaying market growth rates, competitive benchmarking, revenue trends, customer satisfaction metrics, and other key business indicators requiring temporal analysis.
-
How to Use
Enter strategic points or key messages in the three circular icon areas on the left. Input your actual data values into the line chart on the right, adjusting the time axis (2024–2033) and numerical range as needed. Colors and formatting are fully editable to match your brand guidelines.
-
Recommended For
Executive reports, business strategy presentations, market analysis documents, financial performance reviews, marketing plans, and consulting proposals. Ideal for executives, business analysts, strategists, marketing professionals, and data-driven decision makers.
-
Slide Structure
Two-slide set, each featuring a left panel with three circular icon callouts (Value 01–03) and a right panel with a dual-series line chart. The chart displays two data series across eight time points (2024–2033) with a 0–90 range, including legend and value labels for clarity.
Related Products
-

Line Chart for Visualizing Data Changes – Effective Information Delivery
#Market and Competitor Analysis #Graph #Market Analysis
-

Competitor Analysis Graph – Securing Market Advantage
#Market and Competitor Analysis #Graph #Market Analysis
-

Architectural Illustration Templates and Line Charts – Visualizing Market and Competitive Advantage
#Market and Competitor Analysis #Graph #Market Analysis
-

Segmented Bar Graph and Line Graph – Ideal for Market Analysis
#Market and Competitor Analysis #Graph #Market Analysis
