Key Performance Table – Visualizing Business Achievements
RM0200005_6
- Last Update 02/02/2025
- File Size 0.3MB
- # of Slides 2
- File Format PPTX
- Slide Ratio 16:9
- Color
Keywords
- #Content-Based Slides
- #Design-Based Slides
- #Company Introduction
- #Market and Competitor Analysis
- #Diagram
- #Key Achievements
- #Competitive Advantage
- #Table
- #Standard Table
- #16:9
- #performance table PowerPoint slide
- #business metrics template
- #data visualization slide
- #achievement table PPT
- #comparison table download
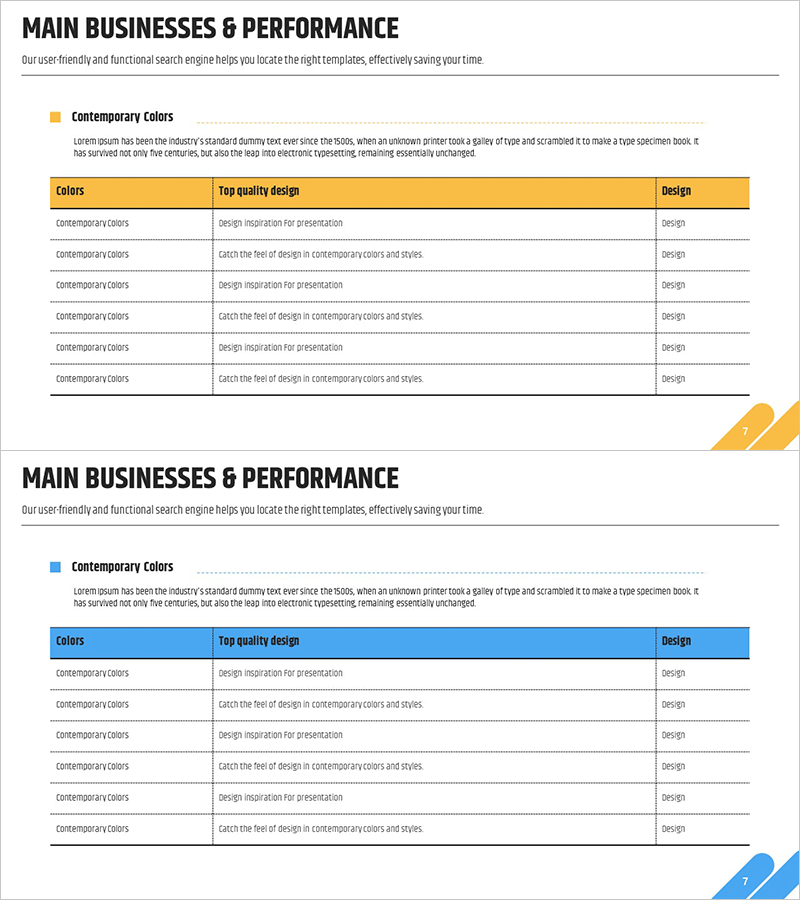
About the Product
A professional 3-column performance table PowerPoint slide designed to clearly present key achievements and business metrics. Features gold and blue dual-tone headers that visually emphasize important data, with editable rows for performance items, descriptions, and results. The 2-slide set is optimized for 16:9 widescreen format and works seamlessly in business reports, executive presentations, and performance review decks. Instantly customizable for quarterly results, competitive advantages, and market analysis data.
Usage Points
-
Main Usage
Organize and present key performance indicators, business achievements, and competitive advantages in a structured table format. The gold and blue dual-tone headers draw attention to critical data, while editable rows allow you to input specific metrics and results for clear audience communication.
-
How to Use
Use in quarterly business reports, executive briefings, annual performance reviews, proposal decks for competitive positioning, and marketing strategy presentations. Easily customize by editing cell text, adjusting header colors, or adding company branding to match your presentation theme.
-
Recommended For
Executives, business managers, marketing teams, and project leads presenting performance data and results. Ideal for quarterly earnings reports, new business performance announcements, client presentations, and internal stakeholder updates.
-
Slide Structure
2-slide set with 3-column × 6-row tables on each slide. Headers are highlighted in gold or blue background for visual emphasis. Optimized for 16:9 widescreen displays with fully editable text cells for seamless data entry and customization.
Related Products
-

Key Performance Analysis Graph – The Power of Data Visualization
#Company Introduction #Market and Competitor Analysis #Diagram
-

Presentation Slide Visualizing Company Performance with Column Chart
#Company Introduction #Market and Competitor Analysis #Diagram
-

Dark AI vs VC Comparison Table Slide – Case Study PowerPoint
#Market and Competitor Analysis #Diagram #Market Status
-

THE ROAD Presentation Table & Tied Vertical Bar Graph – Market and Competitor Analysis
#Market and Competitor Analysis #Diagram #Graph
