Climbing Silhouette and Volume Graph for Performance Visualization – Challenge and Overcoming
RJ0600090_10
- Last Update 07/14/2025
- File Size 1.7MB
- # of Slides 2
- File Format PPTX
- Slide Ratio 16:9
- Color
Keywords
About the Product
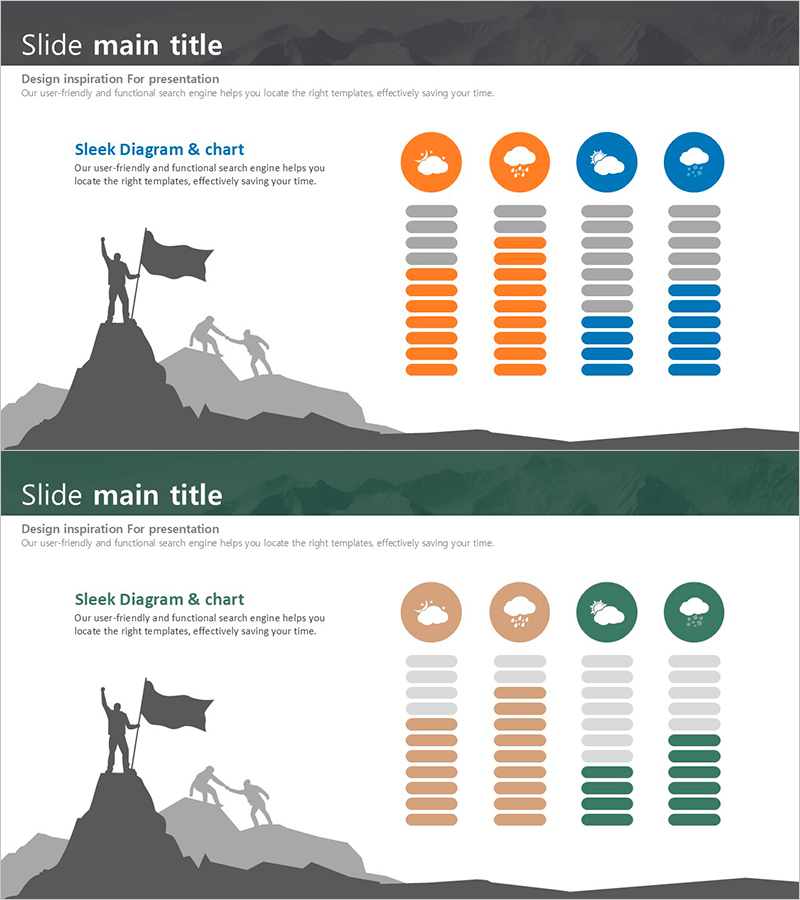
A powerful PowerPoint slide combining a mountain climbing silhouette with a four-item volume graph to visualize business achievement and strategic progress. The silhouette of figures reaching the summit represents the journey of challenge and overcoming, while the stacked volume bars in orange, gray, and blue tones display performance metrics across four dimensions. Ideal for business presentations, annual reports, and investor pitches where you need to communicate strategic execution stages and achievement indicators. The 2-slide set includes two color variations—orange/blue and brown/green—allowing you to match your corporate brand identity while maintaining visual consistency throughout your presentation.
Usage Points
-
Main Usage
This slide emotionally and visually communicates team ambition and achievement milestones. The climbing silhouette symbolizes the journey toward goals, while the four-item volume graph displays performance metrics at each stage, making it ideal for business strategy presentations, quarterly reports, and investor pitches.
-
How to Use
Add your company logo or key message in the left silhouette area, then input actual performance data—such as quarterly revenue, customer acquisition, market share, or team growth—into the four graph sections on the right. Customize the color scheme to match your corporate brand for visual cohesion across your entire presentation.
-
Recommended For
Business performance presentations, quarterly and annual reports, investor relations (IR) pitches, strategic execution plans, and team motivation sessions. Effective for communicating with executives, investors, and team members who need to understand progress against strategic objectives.
-
Slide Structure
Two-slide set, each with a left silhouette area (1 text input zone) and right volume graph section (4 data input zones for individual metrics). First slide features orange/gray/blue palette; second slide offers brown/gray/green palette for flexible brand alignment.
Related Products
-

Modern Business Presentation Template Doughnut Chart1 – Visualizing Performance and Strategy
#Business Strategy #Risk Management and Regulatory Compliance #Graph
-

Bar Chart Visualizing Steak Consumption
#Business Strategy #Market and Competitor Analysis #Graph
-

Ice Hockey Competition Chart – Performance Analysis and Strategy
#Business Strategy #Market and Competitor Analysis #Graph
-

Exercise Ability Improvement Graph
#Business Strategy #Market and Competitor Analysis #Graph
