Future Target Market Share Donut Chart – Performance and Competitiveness
RJ0600073_18
- Last Update 07/09/2025
- File Size 4.2MB
- # of Slides 2
- File Format PPTX
- Slide Ratio 16:9
- Color
Keywords
- #Content-Based Slides
- #Design-Based Slides
- #Business Strategy
- #Market and Competitor Analysis
- #Graph
- #Other
- #Achievements
- #Market Share
- #Circles
- #Doughnut Chart
- #Silhouette
- #16:9
- #donut chart PowerPoint slide
- #pie chart template
- #market share visualization
- #data ratio presentation
- #how to create donut chart in PowerPoint
About the Product
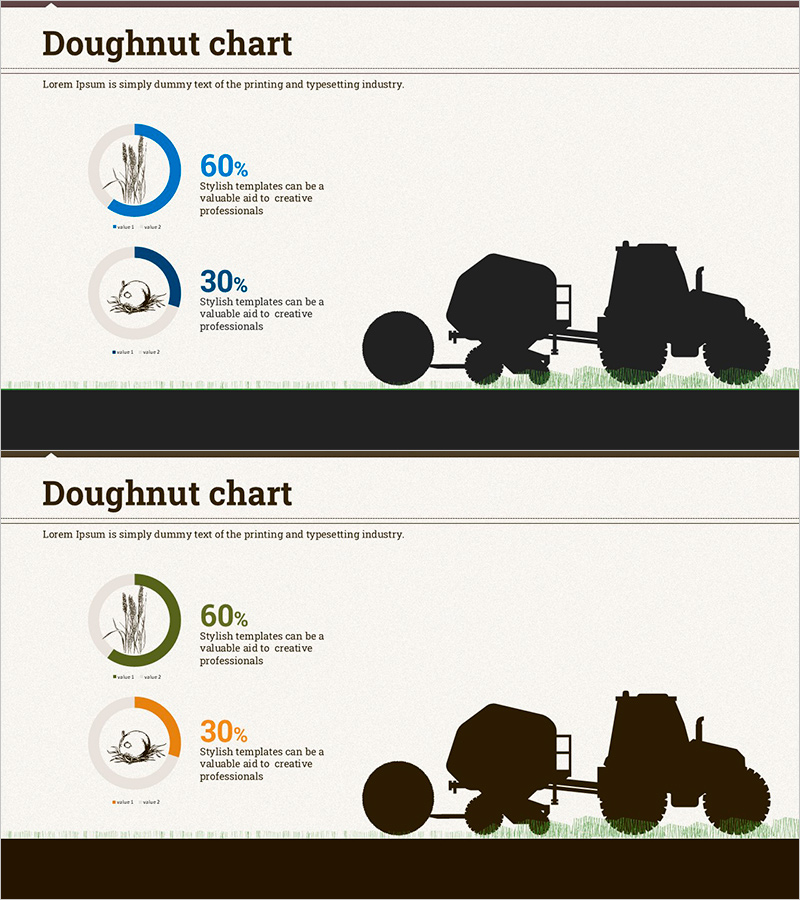
A professional donut chart PowerPoint slide designed for market analysis and competitive assessment presentations. This 2-slide set features two color variations—navy blue and olive green—each displaying data ratios of 60% and 30%. The slides incorporate farm silhouette illustrations to enhance visual storytelling for market share, performance metrics, and competitive positioning. Created in 16:9 widescreen format and fully editable in PPTX, these slides integrate seamlessly into modern business presentations and reports.
Usage Points
-
Main Usage
Visualize proportional data such as market share, competitive positioning, performance metrics, and resource allocation using donut chart format. The hollow center allows for additional data labels or key figures, improving information hierarchy and visual clarity.
-
How to Use
Replace the displayed percentages and text labels with your own data values. Select either the navy blue or olive green version based on your presentation theme and brand colors. Colors and data values are fully customizable within PowerPoint.
-
Recommended For
Executive reports, business plans, marketing proposals, investor presentations, quarterly performance reviews, and strategic planning sessions where proportional data such as market penetration, sales distribution, customer segments, or budget allocation needs clear visual representation.
-
Slide Structure
Two-slide layout with dual donut charts per slide. Upper chart displays 60% ratio, lower chart shows 30% ratio. Left side features icons and descriptive text; right side includes farm silhouette illustration. 16:9 aspect ratio with balanced composition.
Related Products
-

Blue Green Progress Visualization – Graph for Achievement Rate
#Product/Service Introduction #Business Strategy #Market and Competitor Analysis
-

Tricolor Media Usage Graph for Market Share Analysis – Successful Business Strategy
#Business Strategy #Market and Competitor Analysis #Graph
-

Donut Chart and Mobile Mockup – Market Share Analysis
#Business Strategy #Market and Competitor Analysis #Graph
-

Donut Chart for Performance Analysis – Market Share Review
#Business Strategy #Market and Competitor Analysis #Graph
