Mint Green Subdivision Bar Chart – Setting New Standards in Data Visualization
RJ0600088_23
- Last Update 07/14/2025
- File Size 0.4MB
- # of Slides 2
- File Format PPTX
- Slide Ratio 16:9
- Color
Keywords
About the Product
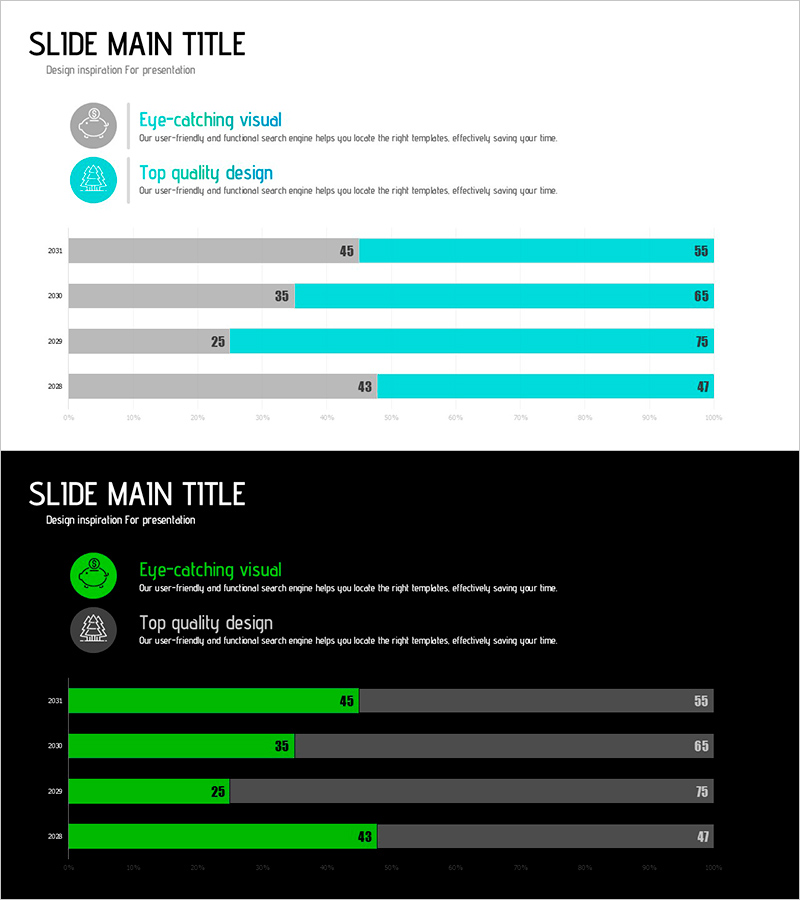
A mint green subdivision bar chart PowerPoint slide for comparing multi-series data across four years. Each horizontal bar is divided into two segments—gray and mint green—enabling clear contrast visualization of dual data sets. Optimized for 16:9 widescreen format with 2 slides ready to use in marketing reports, sales performance reviews, and customer satisfaction analyses. Numeric labels are displayed for precise data communication, and all colors and layouts are fully editable to match your presentation style.
Usage Points
-
Main Usage
Visualize multi-series quantitative data across years, quarters, or regions using horizontal bars. Ideal for presenting marketing performance, sales results, customer satisfaction scores, and cost savings. The mint green and gray color contrast makes series differences immediately apparent to your audience.
-
How to Use
Insert your data values and the bar lengths automatically adjust proportionally. Use in executive reports, quarterly performance reviews, marketing strategy meetings, and investor presentations. Customize colors, fonts, and label positions to match your corporate branding or presentation theme.
-
Recommended For
Marketing teams, sales departments, finance teams, and executives presenting quarterly or annual performance data. Perfect for business reviews, budget assessments, regional comparisons, and data-driven decision-making meetings where clear visual comparison is essential.
-
Slide Structure
2-slide set featuring 4 years of data (2021–2028) with 2 data series per year. Slide 1 uses gray and mint green on white background; Slide 2 features lime green and gray on black background for flexible presentation environments.
Related Products
-

Market Share Analysis with Pie Chart – Precise Data Visualization
#Company Introduction #Market and Competitor Analysis #Graph
-

Comparative Analysis Line Graph – Highlighting Competitive Advantage
#Market and Competitor Analysis #Graph #Competitor Analysis
-

Visualizing Sales Performance with Structural Photos and Graphs
#Financial Plans and Performance #Graph #Sales and Revenue
-

Component Development Status and Share – Effective Data Visualization
#Product/Service Introduction #Market and Competitor Analysis #Graph
