Green & Gray Template Wide Growth Graph
RJ0200067_21
- Last Update 04/18/2025
- File Size 0.4MB
- # of Slides 2
- File Format PPTX
- Slide Ratio 16:9
- Color
Keywords
About the Product
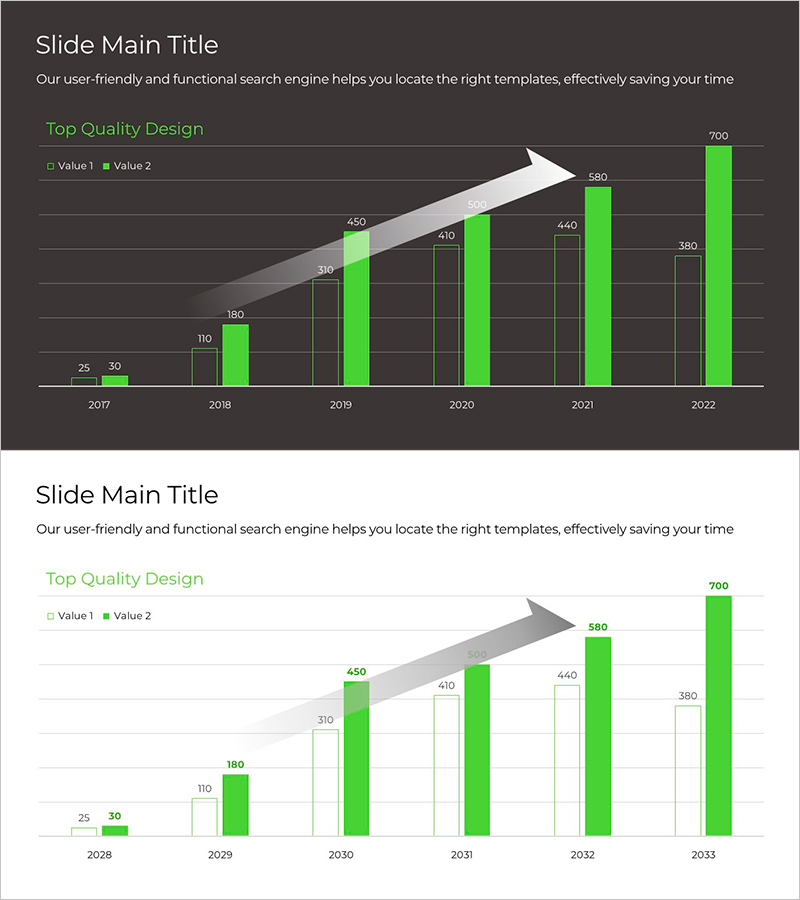
A grouped bar chart PowerPoint slide visualizing six years of growth from 2017 to 2022. Two data series are displayed side-by-side in bright green bars against a dark gray background, with an upward arrow overlay emphasizing growth direction. Each year's numerical values are clearly labeled, making it ideal for communicating positive business performance, revenue increases, and user expansion. The 16:9 widescreen format includes two fully editable slides ready for immediate use in presentations.
Usage Points
-
Main Usage
Compare two or more data series across multiple time periods to clearly visualize growth trends. The upward arrow and green color scheme reinforce positive growth messaging, effectively communicating business achievements to investors, employees, and stakeholders.
-
How to Use
Insert into business plans, quarterly reports, annual performance presentations, and investor pitch decks in the results or performance section. Edit each bar value with your own data and update the legend labels (Value 1 and Value 2) to match your categories. Background and bar colors can be customized to align with your brand identity.
-
Recommended For
Ideal for executives, marketing managers, financial analysts, and consultants presenting business performance. Particularly effective for demonstrating quarterly or annual revenue growth, user acquisition increases, market share expansion, and other positive performance metrics.
-
Slide Structure
Two-slide set. First slide features dark gray background with six grouped bar pairs (2017–2022), each pair showing Value 1 and Value 2 in green, upward arrow overlay, and legend. Second slide uses light background with identical structure for contrast options. 16:9 widescreen format with fully editable elements.
Related Products
-

Comparison Bar Graphs and Core Doughnut Charts – Performance Analysis
#Business Introduction #Business Strategy #Graph
-

Sea Lighthouse Future Competitor Market Forecast Vertical Bar Graph
#Business Strategy #Financial Plans and Performance #Diagram
-

Comparison of Component-Specific Responses According to Conditions
#Business Strategy #Technical Approach #Graph
-

KPI Target vs Actual Slide – 4-Metric Dark Red & Purple
#Company Introduction #Business Strategy #Financial Plans and Performance
