Visualizing Steps for Environmental Protection Practices
RJ0600088_11
- Last Update 07/14/2025
- File Size 0.4MB
- # of Slides 2
- File Format PPTX
- Slide Ratio 16:9
- Color
Keywords
- #Content-Based Slides
- #Design-Based Slides
- #Operational Plan
- #Corporate Social Responsibility
- #Diagram
- #Mitigation Measures
- #Sustainability Programs
- #Flow
- #Linear Flow
- #16:9
- #linear flow diagram PowerPoint
- #3-step diagram slide
- #process flow chart PPT
- #arrow diagram template
- #step-by-step visualization slide
About the Product
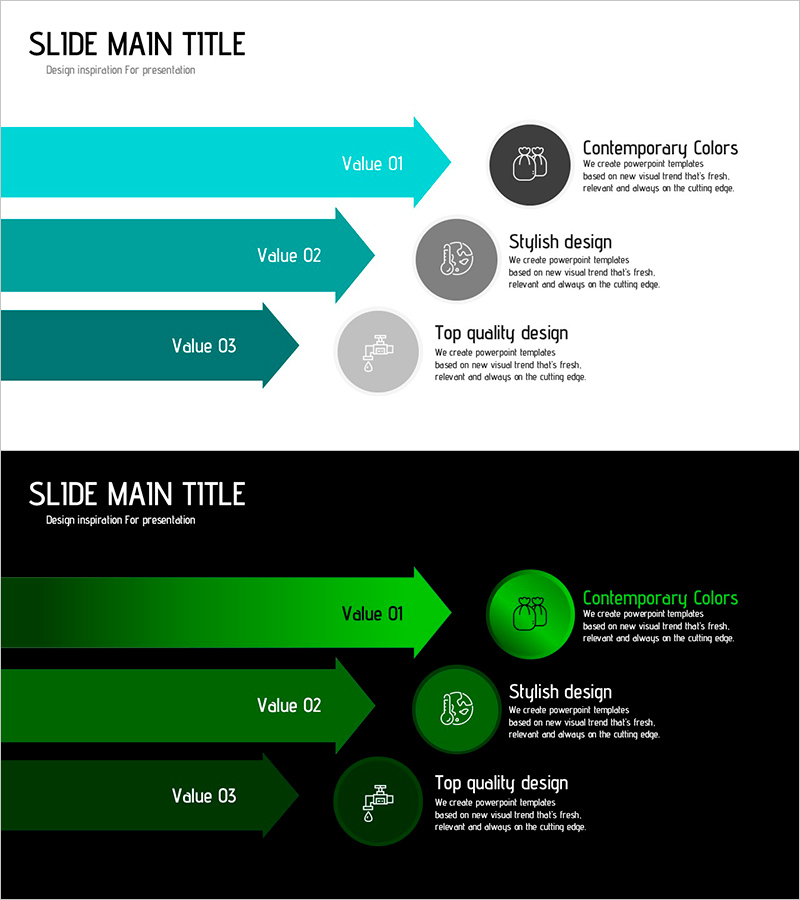
A PowerPoint slide that visualizes environmental protection practices through a 3-step linear flow diagram. Teal gradient arrows progress from left to right, with circular icons and descriptive text positioned on the right side of each step. Two color versions are provided—light background and dark background—making it adaptable to various presentation environments. This PPT diagram is ready to use for business presentations requiring process flows, step-by-step execution plans, and sequential strategy development.
Usage Points
-
Main Usage
This linear flow diagram is optimized for explaining processes, strategies, and execution plans in sequential stages. It works well for environmental protection and sustainability presentations to convey implementation steps, and is applicable to operational plans, project timelines, and improvement processes across all industries.
-
How to Use
Open the slide and replace the text in each step with your own content. Arrows and icons can be freely adjusted in color, size, and position. Choose between the two background versions based on your presentation environment. To add more steps, simply duplicate the arrow and circular icon elements and arrange them accordingly.
-
Recommended For
Environmental and sustainability professionals, operations and project managers, employees presenting strategy and execution plans, educators and seminar facilitators, and government and public sector policy communicators will find this template particularly useful.
-
Slide Structure
2-slide set. Each slide features 3 left-aligned arrows with teal gradient (representing step progression) and 3 circular icons on the right (dark gray, light gray, medium gray) with text areas beside each icon. Optimized for 16:9 widescreen format.
Related Products
-

Flower Wide PPT Diffusion Diagram – Business Strategy and Vision
#Business Vision and Strategy #Operational Plan #Diagram
-

Solutions for Your Execution Goals – Linear Flow of Business Vision
#Business Vision and Strategy #Operational Plan #Diagram
-

Strategies for Empathy and Effective Dialogue – Mastering Communication Crafts
#Business Management #Operational Plan #Diagram
-

Blue Line Wide Template Directional Diagram2 – Visual Flow and Effective Communication
#Product/Service Introduction #Operational Plan #Diagram
