Market Share Analysis with Donut Charts – Squirrels Theme
RJ0600087_9
- Last Update 07/14/2025
- File Size 5.8MB
- # of Slides 2
- File Format PPTX
- Slide Ratio 16:9
- Color
Keywords
About the Product
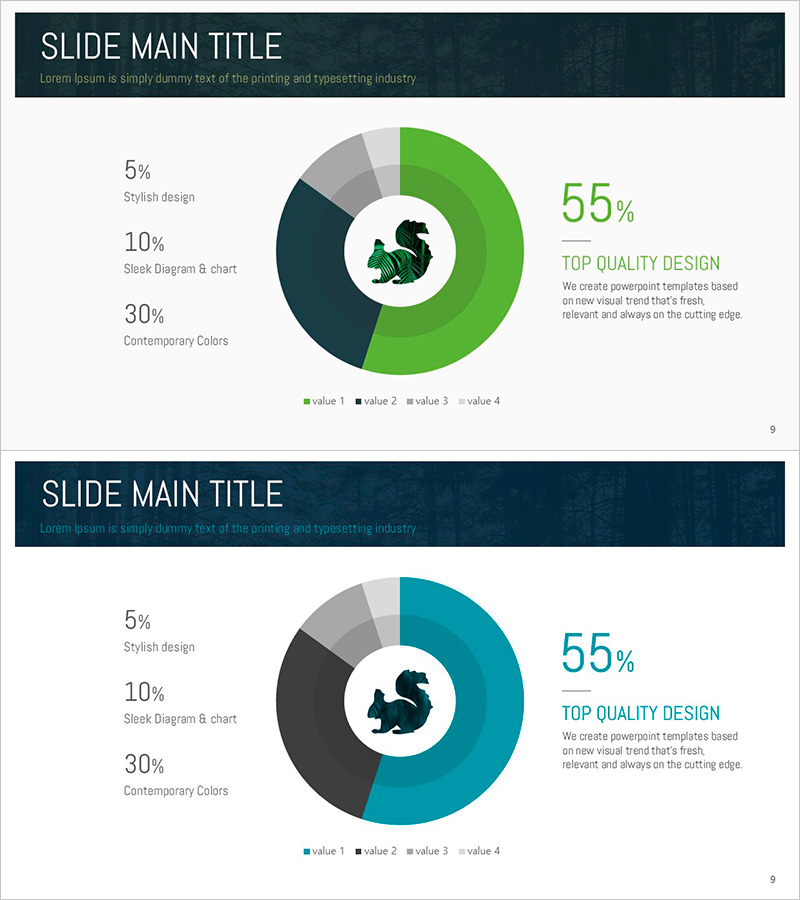
A professional donut chart PowerPoint slide set optimized for market share analysis and data comparison presentations. This 2-slide template features dual color schemes in green and teal gradients, with each slide displaying a 4-segment donut chart for clear ratio visualization. The charming squirrel illustration in the center adds visual interest and approachability to your presentation, while the left text area provides space for detailed explanations and insights. Delivered in 16:9 widescreen PPTX format, fully editable in all modern PowerPoint versions. Perfect for business reports, marketing strategy presentations, sales analysis, and executive briefings where proportional data needs clear visual communication.
Usage Points
-
Main Usage
Effectively visualizes proportional data such as market share, sales distribution, customer demographics, and budget allocation. The donut chart's center space highlights key metrics or messages, while the 2-slide format enables side-by-side comparison of different datasets or time periods.
-
How to Use
Double-click the donut chart area to input your data values and modify the legend labels. Edit the left text box to add analysis, interpretation, and conclusions. Customize colors to match your brand guidelines while maintaining the 16:9 aspect ratio for optimal display on widescreen monitors and projectors.
-
Recommended For
Ideal for marketing teams presenting market analysis, sales teams reporting customer composition, finance teams explaining budget distribution, and executives presenting performance metrics. Best suited for datasets with 4 or fewer segments requiring clear proportional comparison.
-
Slide Structure
2-slide template with each slide containing one 4-segment donut chart and a left-aligned text area. Charts use green, teal, gray, and dark navy colors for segment differentiation. A squirrel illustration anchors the chart center, with a dark header bar at the top for slide titles.
Related Products
-

Logistics Donut Chart – Performance and Market Shares
#Business Strategy #Market and Competitor Analysis #Diagram
-

Travel Destination Infographic Market Share – Intuitive Data Visualization
#Market and Competitor Analysis #Graph #Market Share
-

Palm Donut Chart – Market Share and Data Visualization
#Market and Competitor Analysis #Graph #Market Share
-

Travel Business Competitor Analysis and Market Share – Doughnut Chart Based
#Market and Competitor Analysis #Graph #Market Share
