Vacation Donut Chart – Business Strategy and Market Analysis
RJ0600085_6
- Last Update 07/13/2025
- File Size 0.7MB
- # of Slides 2
- File Format PPTX
- Slide Ratio 16:9
- Color
Keywords
- #Content-Based Slides
- #Design-Based Slides
- #Business Strategy
- #Market and Competitor Analysis
- #Graph
- #Financial Outlook & Expected Impact
- #Future Outlook
- #Circles
- #Doughnut Chart
- #16:9
- #donut chart PowerPoint
- #pie chart slide template
- #ratio comparison chart
- #business analysis presentation
- #how to create donut chart in PowerPoint
About the Product
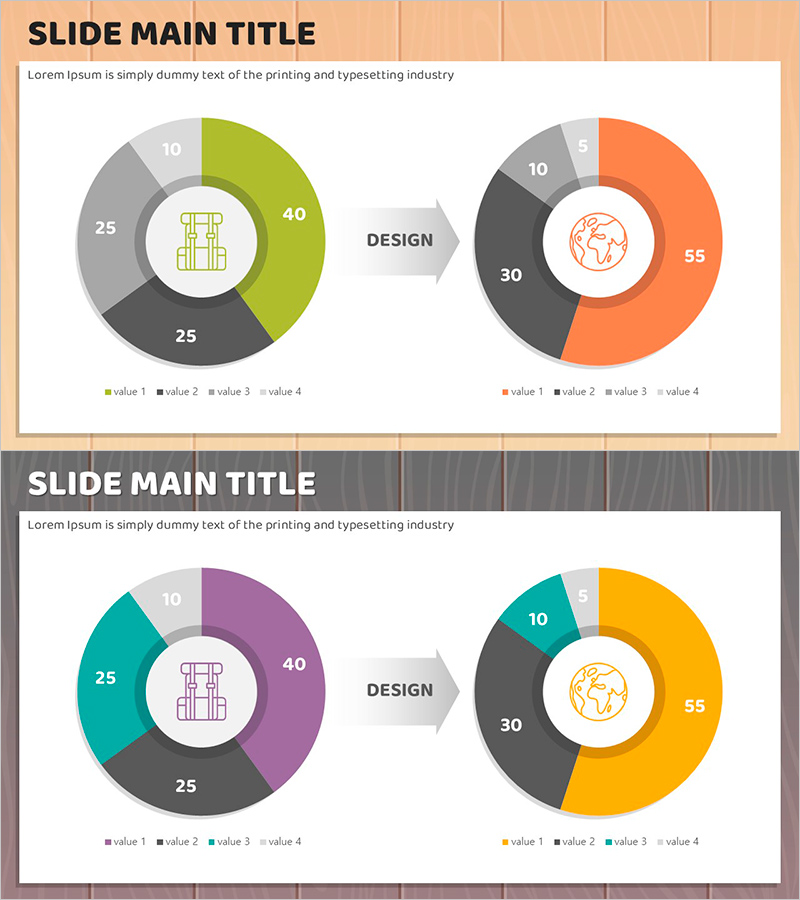
A professional donut chart PowerPoint slide designed to visualize business strategy and market analysis. This 2-slide set features a lime-gray-charcoal color scheme on the left slide with a building icon centered in the donut, and an orange-gray-charcoal combination on the right with a globe icon at the center, emphasizing global perspective. Each segment displays clear numerical values (40, 25, 25, 10) with a connecting arrow showing the relationship between the two charts. Optimized for modern 16:9 widescreen presentations in fully editable PPTX format.
Usage Points
-
Main Usage
Visualize proportional relationships across four key metrics such as business strategy composition, market share, revenue structure, or customer segmentation. The centered icon highlights the core theme while dual color combinations enable before-after or scenario-based comparisons.
-
How to Use
Ideal for executive reports, business plan presentations, marketing strategy meetings, and investor pitch decks where quantitative data requires intuitive visual communication. Simply replace the numerical values with your own data, edit the legend and titles, and deploy immediately.
-
Recommended For
Executives, business planners, marketing managers, financial analysts, and consultants presenting quarterly reports, business proposals, market analysis findings, and strategic initiatives. Particularly effective in data-driven decision-making meetings requiring ratio-based insights.
-
Slide Structure
Slide 1: 4-segment donut chart in lime-gray-charcoal tones with centered building icon and legend (value 1–4). Slide 2: 4-segment donut chart in orange-gray-charcoal tones with centered globe icon and legend. Connecting arrow between slides illustrates transformation or comparative relationship.
Related Products
-

Performance Graph by Year – Results and Future Outlook
#Business Strategy #Market and Competitor Analysis #Graph
-

Abstract Pattern Presentation Line Chart – Visualizing Business Strategies
#Business Strategy #Market and Competitor Analysis #Graph
-

Mint Green Curved Line Trend - Revenue Forecast and Expectations
#Business Strategy #Market and Competitor Analysis #Graph
-

Contribution of Environmental Factors to Growth – Donut Chart
#Business Strategy #Market and Competitor Analysis #Graph
