Sea Life Population Graph – Emphasizing Results Through Data Visualization
RJ0600081_28
- Last Update 07/12/2025
- File Size 1.8MB
- # of Slides 2
- File Format PPTX
- Slide Ratio 16:9
- Color
Keywords
- #Content-Based Slides
- #Design-Based Slides
- #Business Strategy
- #Graph
- #Text Box
- #Achievements
- #Horizontal Bar
- #Grouped Horizontal Bar
- #Rounded Rectangle Text Box
- #16:9
- #sea life population chart PowerPoint
- #bar graph data visualization slide
- #marine biology presentation template
- #dual-series chart template
- #environmental data PowerPoint slide
About the Product
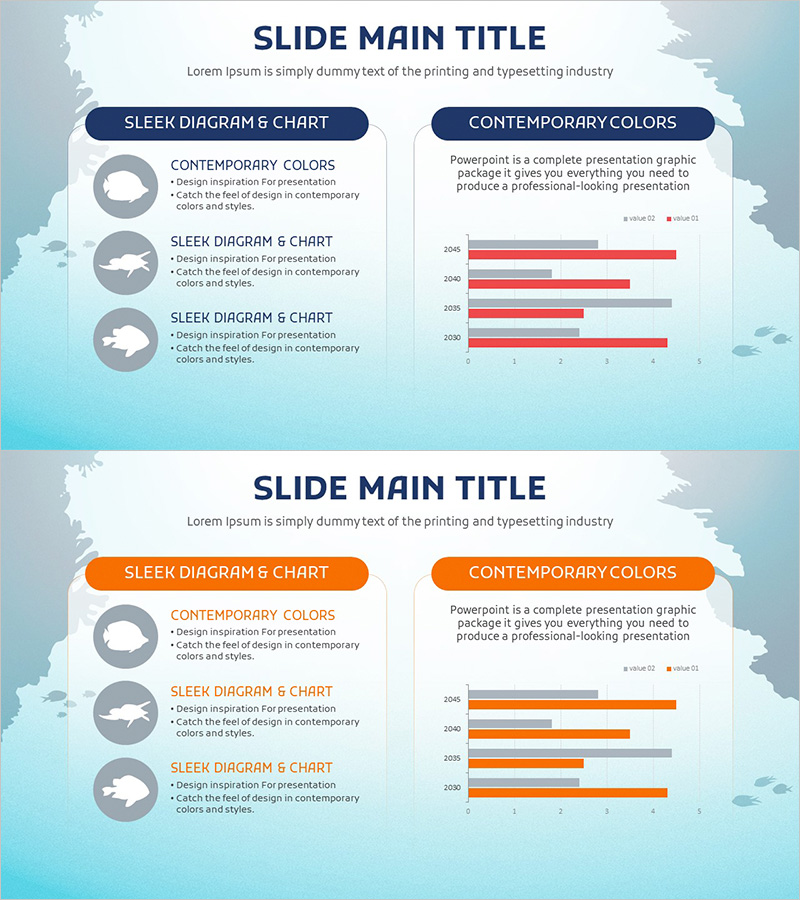
A 2-slide PowerPoint presentation template visualizing sea life population changes through dual-color bar charts. The design combines navy and orange accent colors with circular silhouette icons on the left panel and a multi-year comparative bar graph on the right. Three icon-based information blocks with descriptive text are positioned alongside a 4-year dual-series bar chart, creating a balanced layout for effective data communication. Available in 16:9 widescreen PPTX format with fully editable elements. Ideal for business strategy presentations, performance reports, environmental data analysis, and ecological monitoring results.
Usage Points
-
Main Usage
Effectively communicate sea life population trends, environmental changes, and ecosystem monitoring results. The navy and orange dual-color scheme establishes credibility while drawing attention to key data points. The balanced layout of left-side icon panels and right-side charts maximizes information clarity and audience engagement.
-
How to Use
Enter sea life species names, characteristics, or observation categories in the left circular icon areas. Input year-by-year population data into the right bar chart, using navy bars for baseline data and orange bars for comparative metrics. All text, numbers, and chart values are fully editable to match your specific dataset.
-
Recommended For
Environmental and ecological research presentations, marine resource management reports, fisheries performance analysis, biodiversity project proposals, academic seminars, and government agency policy briefings. Suitable for executives, planning teams, and research departments requiring data-driven decision-making presentations.
-
Slide Structure
2-slide template. Each slide contains: title area + left panel with 3 circular silhouette icons (each with 3-line descriptive text) + right side dual-series bar chart (navy, orange, and gray colors, Y-axis scale 0–5) showing 4-year comparison. 16:9 widescreen aspect ratio, fully editable PPTX format.
Related Products
-

Quarterly Sales Comparison – Market Performance and Competitive Advantage
#Business Strategy #Market and Competitor Analysis #Graph
-

Management Performance Analysis Bundle Chart
#Business Strategy #Market and Competitor Analysis #Graph
-

Visualizing Seminar Insights – Business Strategy and Market Analysis
#Business Strategy #Market and Competitor Analysis #Text Box
-

Bundled Graph for Market Performance Analysis – Leveraging Competitive Advantage
#Business Strategy #Market and Competitor Analysis #Graph
