Botanic Garden Management Item Table – Financial Performance and Data Visualization
RJ0600083_27
- Last Update 07/12/2025
- File Size 1MB
- # of Slides 2
- File Format PPTX
- Slide Ratio 16:9
- Color
Keywords
- #Content-Based Slides
- #Design-Based Slides
- #Financial Plans and Performance
- #Diagram
- #Balance Sheet
- #Key Financial Indicators
- #Table
- #16:9
- #financial data table PowerPoint slide
- #financial metrics visualization
- #balance sheet PPT template
- #investor presentation table
- #how to create financial data table in PowerPoint
About the Product
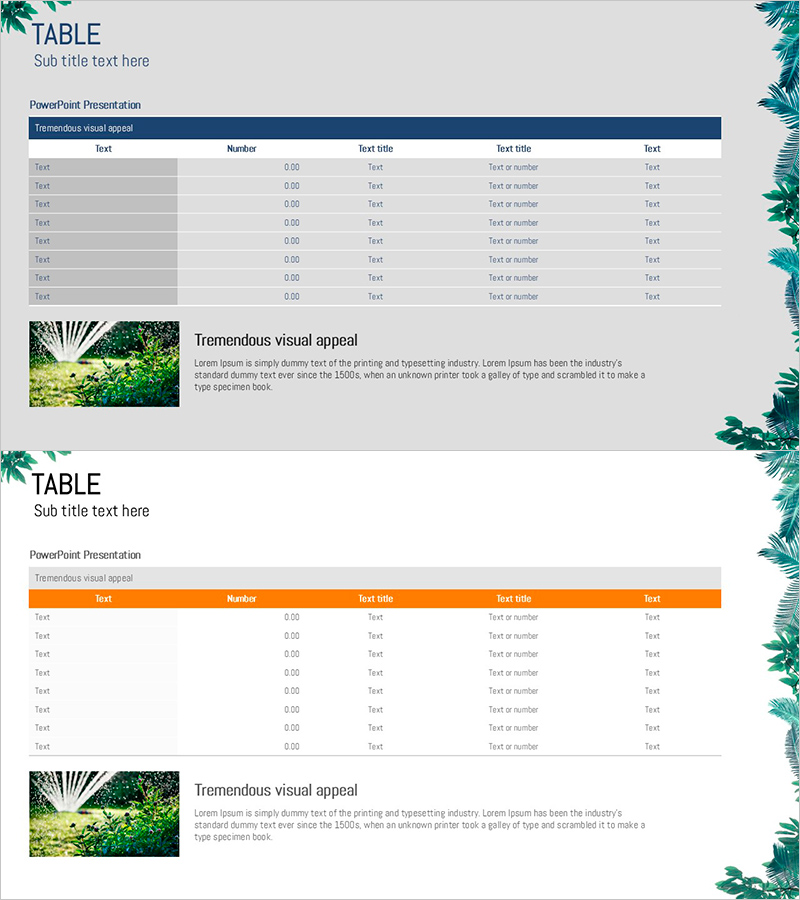
A professional PowerPoint table slide designed to visualize financial performance and key metrics with exceptional clarity. Features a dark blue header row and light gray data rows that maximize readability and data comprehension. The 6-column by 8-row structure accommodates balance sheets, income statements, cash flow statements, and financial KPIs. Ideal for investor presentations, financial reports, and quarterly earnings decks. The slide includes an image placeholder in the upper right corner for company branding or additional visuals, and a text area at the bottom for data interpretation and key insights. Ready to download and customize immediately for your financial presentation needs.
Usage Points
-
Main Usage
Presents financial data, key performance indicators, and numerical results in a structured, easy-to-read format. The dark blue header clearly defines information hierarchy, while light gray rows facilitate row-by-row scanning, enabling audiences to quickly grasp financial performance and trends.
-
How to Use
Use in investor presentations, financial reports, and IR materials to display balance sheets, income statements, cash flow statements, and budget summaries. Input numerical data into each cell and use the bottom text area to provide data interpretation, analysis, and strategic insights that support decision-making.
-
Recommended For
CFOs, financial managers, investor relations professionals, and executives presenting financial results. Particularly valuable for quarterly and annual earnings reports, shareholder meetings, bank loan applications, and M&A negotiation materials where credible financial data representation is essential.
-
Slide Structure
Organized as a 6-column by 8-row data table with dark blue header row containing white text and light gray data rows for visual contrast. Includes an image insertion area in the upper right corner for branding and a text explanation area at the bottom for contextual analysis and key takeaways.
Related Products
-

Checklist Table Slide for Financial Planning
#Financial Plans and Performance #Diagram #Balance Sheet
-

Balance Sheet Table Chart – Visualizing Financial Plans and Performance
#Financial Plans and Performance #Diagram #Balance Sheet
-

Green Brown Statistics Table – Financial Performance Analysis
#Financial Plans and Performance #Diagram #Balance Sheet
-

Triangle Pattern PPT Table Chart – Visualizing Financial Performance
#Financial Plans and Performance #Diagram #Balance Sheet
