Construction Business Balance Sheet - The Start of Clear Financial Management
RM0500004_26
- Last Update 02/20/2025
- File Size 1.4MB
- # of Slides 2
- File Format PPTX
- Slide Ratio 16:9
- Color
Keywords
- #Content-Based Slides
- #Design-Based Slides
- #Financial Plans and Performance
- #Diagram
- #Balance Sheet
- #Key Financial Indicators
- #Table
- #16:9
- #balance sheet PowerPoint slide
- #financial table presentation
- #how to make a balance sheet in PowerPoint
- #financial data slide template
- #construction business financial PPT
About the Product
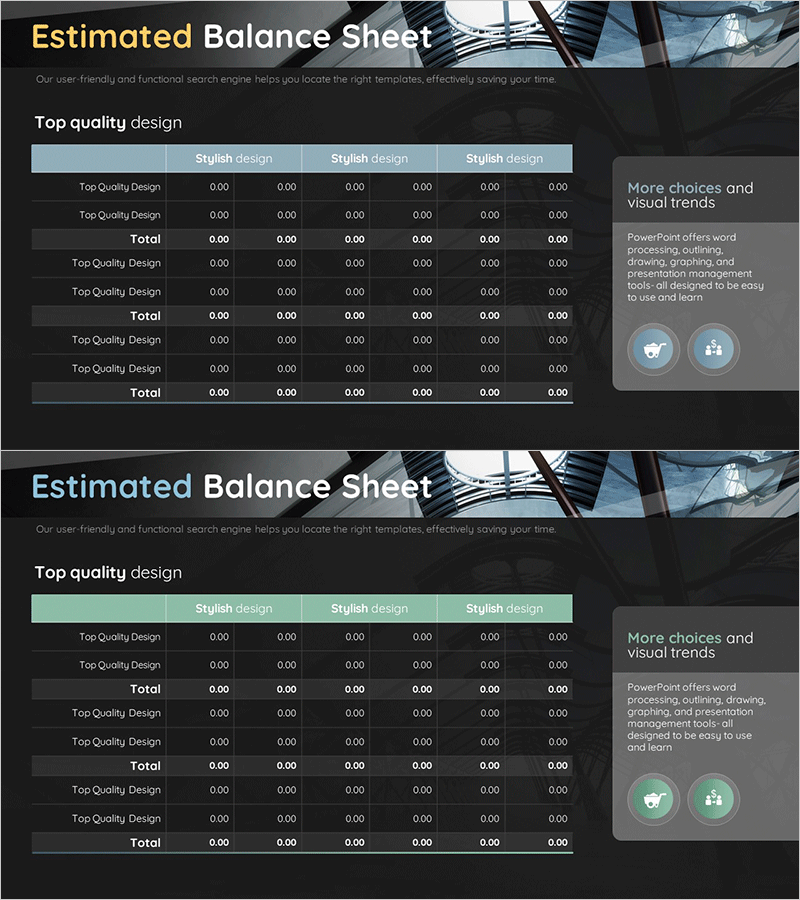
A professional balance sheet PowerPoint slide designed for construction businesses and general enterprises to clearly present financial status. This 2-slide set offers two color options—blue and mint—allowing you to select the design that best matches your presentation context and corporate image. The table layout systematically organizes assets, liabilities, and equity items to maximize financial data readability. Instantly applicable for investor presentations, financial reports, business plan pitches, and other scenarios requiring credible financial information delivery.
Usage Points
-
Main Usage
Systematically visualizes a company's financial position by breaking down assets, liabilities, and equity to deliver credible financial information to investors, financial institutions, and employees. A core slide for demonstrating financial soundness across all industries including construction, manufacturing, and financial services.
-
How to Use
Place in the financial section of investor relations materials, financial reports, business plan presentations, and investment pitch decks. Select the blue option to emphasize stability and trustworthiness, or the mint option to highlight innovation and growth potential, matching your corporate image and presentation objectives.
-
Recommended For
CFOs, financial managers, investor relations specialists, and business development professionals explaining financial status. Ideal for construction companies, manufacturers, and startups pitching to investors; banks and insurance companies conducting client briefings; and public companies presenting quarterly earnings.
-
Slide Structure
2-slide set, each featuring a balance sheet table format. Left column lists item categories (assets, liabilities, equity, etc.) with 6 data entry columns on the right. Header row and subtotal/total rows are clearly distinguished. Available in blue and mint color schemes.
Related Products
-

Balance Sheet Table Slide – Foundation for Financial Planning
#Financial Plans and Performance #Diagram #Balance Sheet
-

Balance Sheet Chart for Financial Planning Slide
#Financial Plans and Performance #Diagram #Balance Sheet
-

Organize Financial Plans with Abstract Pattern Template
#Financial Plans and Performance #Diagram #Balance Sheet
-

Liquidity Management and Cash Flow Forecasting Table – Clear Balance Sheet Reflecting Financial Performance
#Financial Plans and Performance #Diagram #Balance Sheet
