Coffee Consumption Survey by Gender – Visual Data Infographic
RJ0600057_17
- Last Update 07/05/2025
- File Size 4.9MB
- # of Slides 2
- File Format PPTX
- Slide Ratio 16:9
- Color
Keywords
- #Content-Based Slides
- #Design-Based Slides
- #Market and Competitor Analysis
- #Financial Plans and Performance
- #Diagram
- #Graph
- #Other
- #Customer Analysis
- #Sales and Revenue
- #Spread
- #16:9
- #gender coffee consumption PowerPoint
- #data comparison infographic slide
- #coffee consumption chart PowerPoint
- #market analysis visualization slide
- #customer segmentation PPT
About the Product
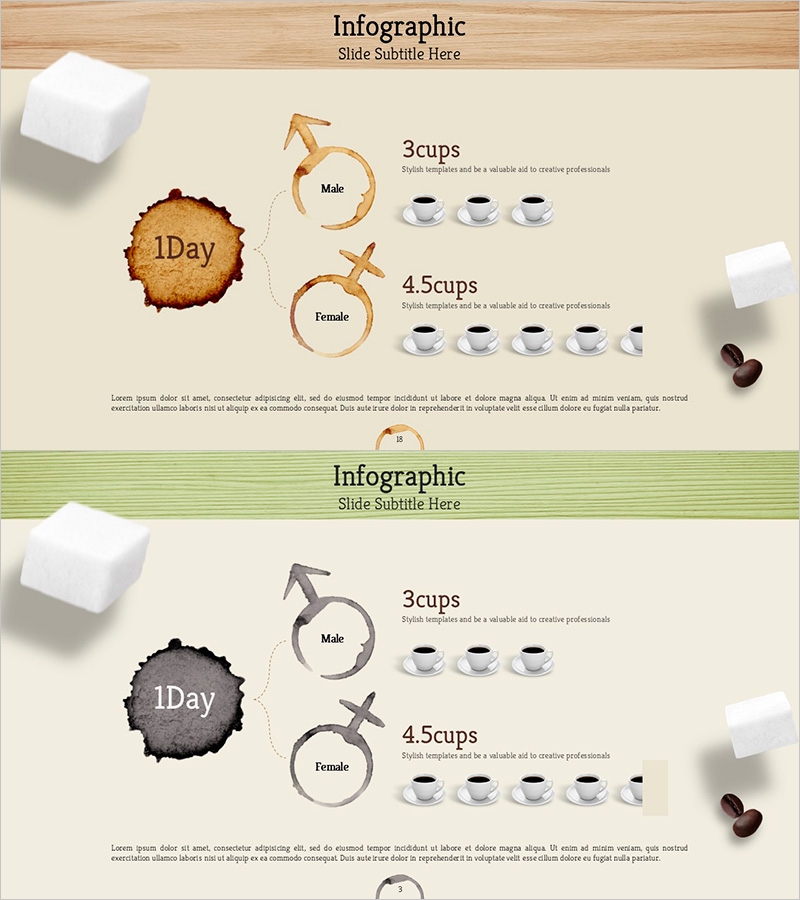
A PowerPoint slide set visualizing coffee consumption differences by gender with clear data comparison. The beige-toned background features brown circular charts and coffee cup icons to intuitively compare male and female consumption at 3 cups and 4.5 cups respectively. The 2-slide layout includes a wooden frame header at the top and text area at the bottom for presenting data insights. Immediately applicable to market analysis, customer segmentation, and consumer trend presentations.
Usage Points
-
Main Usage
Effectively compare coffee consumption differences across gender demographics and communicate market segmentation data. The circular chart and icon combination transforms numerical information into intuitive visuals that enhance audience comprehension and engagement.
-
How to Use
Use in market analysis, customer analysis, and consumer trend presentation sections to explain gender-specific consumption patterns. Add slide titles in the header area and analysis results with insights in the text section to support data-driven decision-making.
-
Recommended For
Marketing professionals, market research analysts, sales planning teams, and business executives preparing reports. Particularly valuable for beverage and food industries, consumer goods companies, and marketing agencies presenting consumer segmentation analysis.
-
Slide Structure
2-slide format with wooden frame header (title area), central brown circular charts (male/female distinction), right-aligned coffee cup icon arrays (3 cups/4.5 cups indicators), and bottom text description area. Fully editable text boxes allow flexible customization of data and analysis content.
Related Products
-

Gender Analysis Chart – Ideal for Market & Customer Analysis
#Market and Competitor Analysis #Financial Plans and Performance #Graph
-

Mixed Charts and Customer Analysis – Visualizing Customer Insights
#Market and Competitor Analysis #Financial Plans and Performance #Graph
-

Bundled Vertical Bar Graph Blue Green – Market and Customer Analysis
#Market and Competitor Analysis #Financial Plans and Performance #Graph
-

Hologram Wide PowerPoint Area Chart – Embodying Contemporary Sensibility
#Operational Plan #Financial Plans and Performance #Graph
