Sea Illustration Market Trend Chart – Visual Market Analysis
RJ0600081_6
- Last Update 07/12/2025
- File Size 1.5MB
- # of Slides 2
- File Format PPTX
- Slide Ratio 16:9
- Color
Keywords
- #Content-Based Slides
- #Design-Based Slides
- #Market and Competitor Analysis
- #Diagram
- #Graph
- #Industry Trends
- #Table
- #Column
- #Standard Table
- #Segmented Column
- #16:9
- #stacked column chart PowerPoint
- #market trend slide template
- #data visualization presentation
- #how to create column chart in PowerPoint
- #business analysis slide download
- #financial report PowerPoint template
About the Product
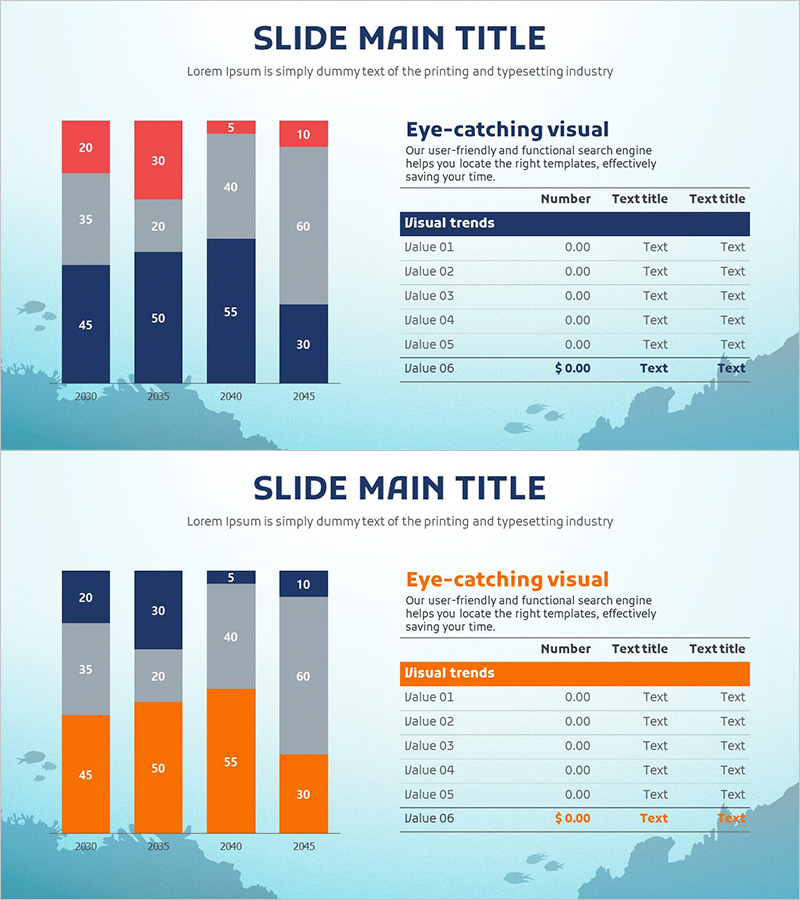
A PowerPoint slide combining ocean illustration with stacked column chart for market trend analysis. Visualizes data across four years from 2030 to 2045, comparing five data series per year with clear numerical representation. Features a three-color palette of navy, gray, and orange in a stacked bar structure, with a detailed data table positioned on the right side. Ready for immediate use in presentations and slides, with fully editable text and numerical values for customization.
Usage Points
-
Main Usage
Optimized for visualizing year-over-year market trends, sales performance, and growth trajectories through numerical comparison. The stacked column structure simultaneously displays total volume and component breakdown, while the accompanying data table provides precise figures.
-
How to Use
Ideal for business reports, marketing presentations, investor briefings, and quarterly performance reviews when explaining market size evolution and competitive analysis. The ocean illustration background suits maritime, tourism, and fisheries industry presentations.
-
Recommended For
Executives, marketing managers, sales teams, financial analysts, consultants, and educators explaining data-driven decisions. Recommended for quarterly and annual performance analysis, market size trends, and customer segment revenue comparisons.
-
Slide Structure
Two-slide set. Each slide contains a stacked column chart for four years (2030, 2035, 2040, 2045) and a data table with six value rows (Value 01–06). Bars are color-coded across five series, with table headers highlighted in navy background and white text.
Related Products
-

Business Trend Graph by Year – Market Analysis Insight
#Market and Competitor Analysis #Financial Plans and Performance #Diagram
-

Structure Presentation Template Segmented Vertical Bar Graph – Market Trends and Performance Analysis
#Market and Competitor Analysis #Financial Plans and Performance #Diagram
-

Segment Chart for Market Trends – Green Orange Theme
#Market and Competitor Analysis #Diagram #Graph
-

Analyzing Future Prospect Graphs
#Market and Competitor Analysis #Diagram #Graph
