Marking Milestones with Market Data – Market Status and Share
RB0800033_6
- Last Update 03/24/2025
- File Size 6.5MB
- # of Slides 2
- File Format PPTX
- Slide Ratio 4:3
- Color
Keywords
- #Content-Based Slides
- #Design-Based Slides
- #Market and Competitor Analysis
- #Graph
- #Market Status
- #Market Share
- #Circles
- #Doughnut Chart
- #4:3
- #donut chart PowerPoint
- #pie chart slide template
- #market share visualization
- #data representation slides
- #ratio chart presentation
- #business analytics PowerPoint
About the Product
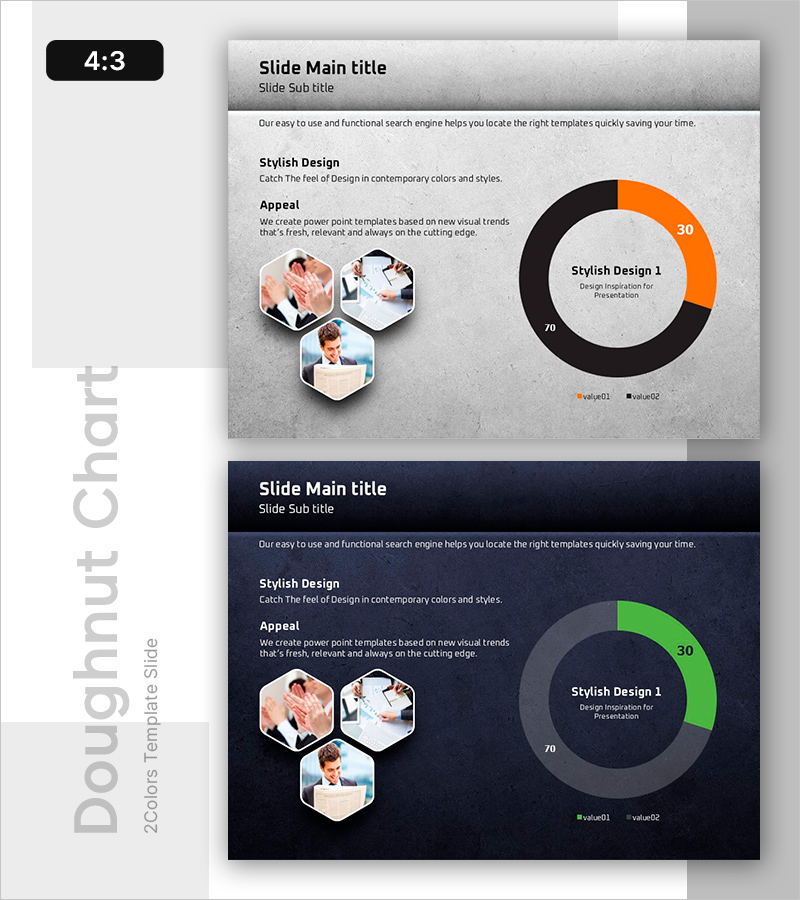
A professional donut chart PowerPoint slide that visualizes market status and share with clarity and impact. The donut graph features black and orange color segments representing a 30:70 data ratio, with a central text area for key messaging. This 4:3 aspect ratio template includes 2 slides ready for immediate use in business presentations, marketing plans, and investor pitches. The design combines hexagonal image placeholders on the left with the donut chart on the right, creating a balanced layout that emphasizes data-driven storytelling. Perfect for presenting market analysis, competitive positioning, and revenue distribution in executive presentations.
Usage Points
-
Main Usage
Effectively communicates proportional data such as market share, product distribution, customer segments, and revenue breakdown. The central donut area allows placement of key metrics or messages, drawing focus to the most important data point while the surrounding segments provide comparative context.
-
How to Use
Ideal for market analysis sections in business plans, competitive landscape slides in marketing decks, market size explanations in investor presentations, and quarterly performance reports showing market penetration. Two background versions (dark navy and light gray) allow seamless integration into different presentation themes and color schemes.
-
Recommended For
Marketing managers, executives, business development professionals, financial analysts, and consultants who need to present data-driven insights. Particularly effective for C-suite briefings, investor relations presentations, and competitive analysis meetings where visual clarity of market positioning is critical.
-
Slide Structure
Two-slide template featuring a centered donut chart with two data series (representing 30% and 70% proportions), three hexagonal image frames on the left side, and a legend with text annotation area on the right. Fully editable elements in 4:3 aspect ratio PPTX format for customization of colors, labels, and data values.
Related Products
-

Donut Chart: Feature Usage Ratio in Mobile Banking
#Market and Competitor Analysis #Diagram #Graph
-

Eucalyptus Donut Chart – Visualization for Market Analysis
#Market and Competitor Analysis #Graph #Market Status
-
![Analysis of [3 Key Factors] with Donut Chart - Market Status and Share](https://image.goodpello.com/2025/08/16/9c5d48b8-118b-499e-a39c-4b78a2acdc1e.jpg?w=300&h=336&format=auto)
Analysis of [3 Key Factors] with Donut Chart - Market Status and Share
#Market and Competitor Analysis #Graph #Market Status
-

Smoking Rates among Lung Cancer Patients – Market Analysis
#Market and Competitor Analysis #Graph #Market Status
