Sea Wide PPT Market Analysis and Summary
RJ0600081_22
- Last Update 07/12/2025
- File Size 1.8MB
- # of Slides 2
- File Format PPTX
- Slide Ratio 16:9
- Color
Keywords
- #Content-Based Slides
- #Design-Based Slides
- #Market and Competitor Analysis
- #Graph
- #Market Analysis
- #Market Overview
- #Line
- #Line Chart
- #16:9
- #line chart PowerPoint
- #market analysis presentation slide
- #trend data visualization
- #2-series chart template
- #ocean theme business presentation
- #sales report PowerPoint slide
About the Product
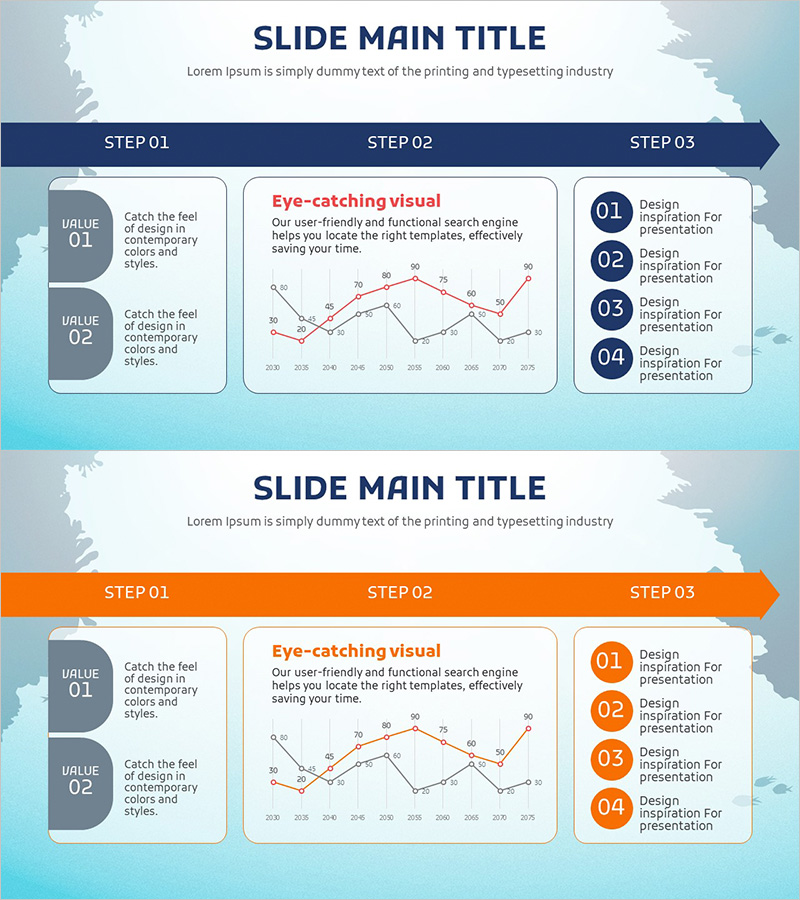
A line chart PowerPoint slide designed for market analysis and business performance reporting. This presentation template visualizes two data series showing trend changes over time, enhanced by an ocean-themed blue and gray color palette with map background that emphasizes global market context. The slide features a 3-step process flow (VALUE 01·02 → Eye-catching visual → Design Inspiration) alongside a 4-item list, making it immediately applicable to sales reports, business presentations, and marketing strategy decks. Provided in 16:9 widescreen PPTX format with 2 slides containing fully editable text boxes and data points.
Usage Points
-
Main Usage
Visualizes changes in two or more data series over time, such as market trends, sales performance, or comparative metrics. The ocean and global market theme makes it ideal for international business presentations, while the line format intuitively conveys data fluctuations, growth, and volatility.
-
How to Use
Enter two key insights in the left VALUE section, replace the center line chart with your actual data series, and populate the right Design Inspiration list with four analysis conclusions or action items. This creates a complete 3-step storytelling narrative for your audience.
-
Recommended For
Recommended for quarterly and annual performance reports by executives, finance teams, marketing departments, and sales teams. Suitable for market research presentations, competitive analysis, global business status updates, and investor pitch decks.
-
Slide Structure
2-slide set: Slide 1 features a blue arrow 3-step header (STEP 01·02·03) with left gray VALUE boxes (2 items), center line chart (2 series, approximately 10 data points), and right numbered circle list (01–04). Slide 2 provides the same layout with orange arrow header. All text, numbers, and legend elements are fully editable.
Related Products
-

Line Charts for Design Tasks – Market and Competitor Analysis
#Market and Competitor Analysis #Graph #Future Outlook
-

Architectural Illustration Templates and Line Charts – Visualizing Market and Competitive Advantage
#Market and Competitor Analysis #Graph #Market Analysis
-

The Jumping Boys and Bell Charts - Data Visualization for Market Analysis
#Market and Competitor Analysis #Graph #Market Analysis
-

Business Analysis Line Graph – Visualizing Market Trends
#Market and Competitor Analysis #Graph #Market Status
